Create Worksheets
| Worksheet creation is deprecated starting in the 10.4.0.cl release, and is disabled by default. If you need to create a Worksheet and the option is not available to you in ThoughtSpot, contact your ThoughtSpot administrator to enable Worksheet creation. |
To model your use case and optimize ThoughtSpot Search, create a Worksheet.
Whenever you start a new analytics inquiry, the most important question to ask is "What use case does this support?"
We recommend that you keep the following points in mind as you select your use case, and then design a Worksheet to support it.
Good use cases support:
-
Actionable data, and measurable value
-
Time value of Answers
-
Variability of questions
-
Large addressable audience
-
Large data volume, and need for granular analysis at variable levels
-
Relational data that is modeled for analytical use
Worksheets provide a simplified view of your data for users to search. We designed them to directly support use cases, so they have the following advantages when compared to searching directly across tables:
-
Optimize the Search experience
-
Present only relevant data columns, to reduce information overload
-
View flat presentation of combined data tables
-
Rename columns and terms
-
Enable change of numerical columns from measurement (default) to attribute
-
Specify default aggregation functions
-
Specify formatting and currency symbols
-
Identify columns that contain geographical data
-
Match the user vocabulary by mapping data to recognizable business concepts
-
Standardize formulas for consistency and governance
-
Give a user or group access to only part of the underlying data
-
Give users a filtered set of data to search
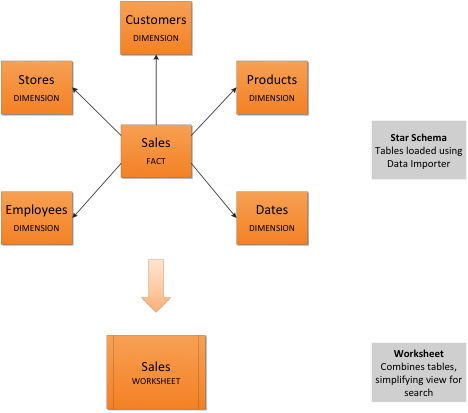
Typically, you create one Worksheet for each set of fact and dimension tables. For example, you may have a sales fact table and an inventory fact table. Each of these fact tables shares common dimensions like date, region, and store. In this scenario, you would create two Worksheets: sales and inventory. The following diagram depicts the schema involved in creating the sales Worksheet.

To simplify data modeling, ThoughtSpot supports automated Worksheet creation during Setup. When creating a Worksheet through the Setup tab, you can view suggested joins, and take advantage of data modeling best practices, making your data easier to search.
To prepare a worksheet for optimal performance with Sage, follow these essential preparatory steps outlined here.
Create a Worksheet through Setup
To generate a Worksheet through the Setup tab, follow these steps:
-
Complete Step 1 of Setup, setting up your connection.
-
Select Step 2, Model data and create a Worksheet. Select Create Worksheet in the lower-left corner. A list of the available fact tables from your connection appears.
-
By default, ThoughtSpot suggests the fact table with the largest number of rows. Select the box next to the fact table from which you would like to create your Worksheet and select Next.
After the Worksheet is created, you will have the option to add more fact tables to its schema. -
A list of the available dimension tables from your connection appears. Choose the dimension table(s) to join to your fact table and select Next. You can choose up to four dimension tables.
-
The joins interface appears, showing a join based on a column of data both tables contain. You can proceed with the suggested join, or select the column names to change the join.
The default join type is Inner, which will yield all search results with matching values from the fact table and the dimension table. You can select the Venn diagram icon to change the join type. -
Select Next. The columns view of your Worksheet appears. You may notice that the column names have been changed to make them more easily searchable (for example, underscores may be replaced with spaces).
-
[Optional] Select My Worksheet to change the name of your Worksheet.
-
[Optional] Select the column titles to change the names of your searchable columns. You can also select the blue checkbox next to a column name to remove it from your Worksheet.
-
[Optional] Select the data type under Type to change the recorded data type. For example, you can change a data type like Zip code from ‘Measure’ to ‘Attribute’.
-
Select Save worksheet. Your Worksheet is now available to search and share.
Joins created in the setup of a Worksheet are inherited at the table level. To remake your auto-generated Worksheet through the Setup tab, you must first delete the Worksheet, then delete the joins at the table level.
Create a Worksheet manually
Follow these steps to create Worksheets:

-
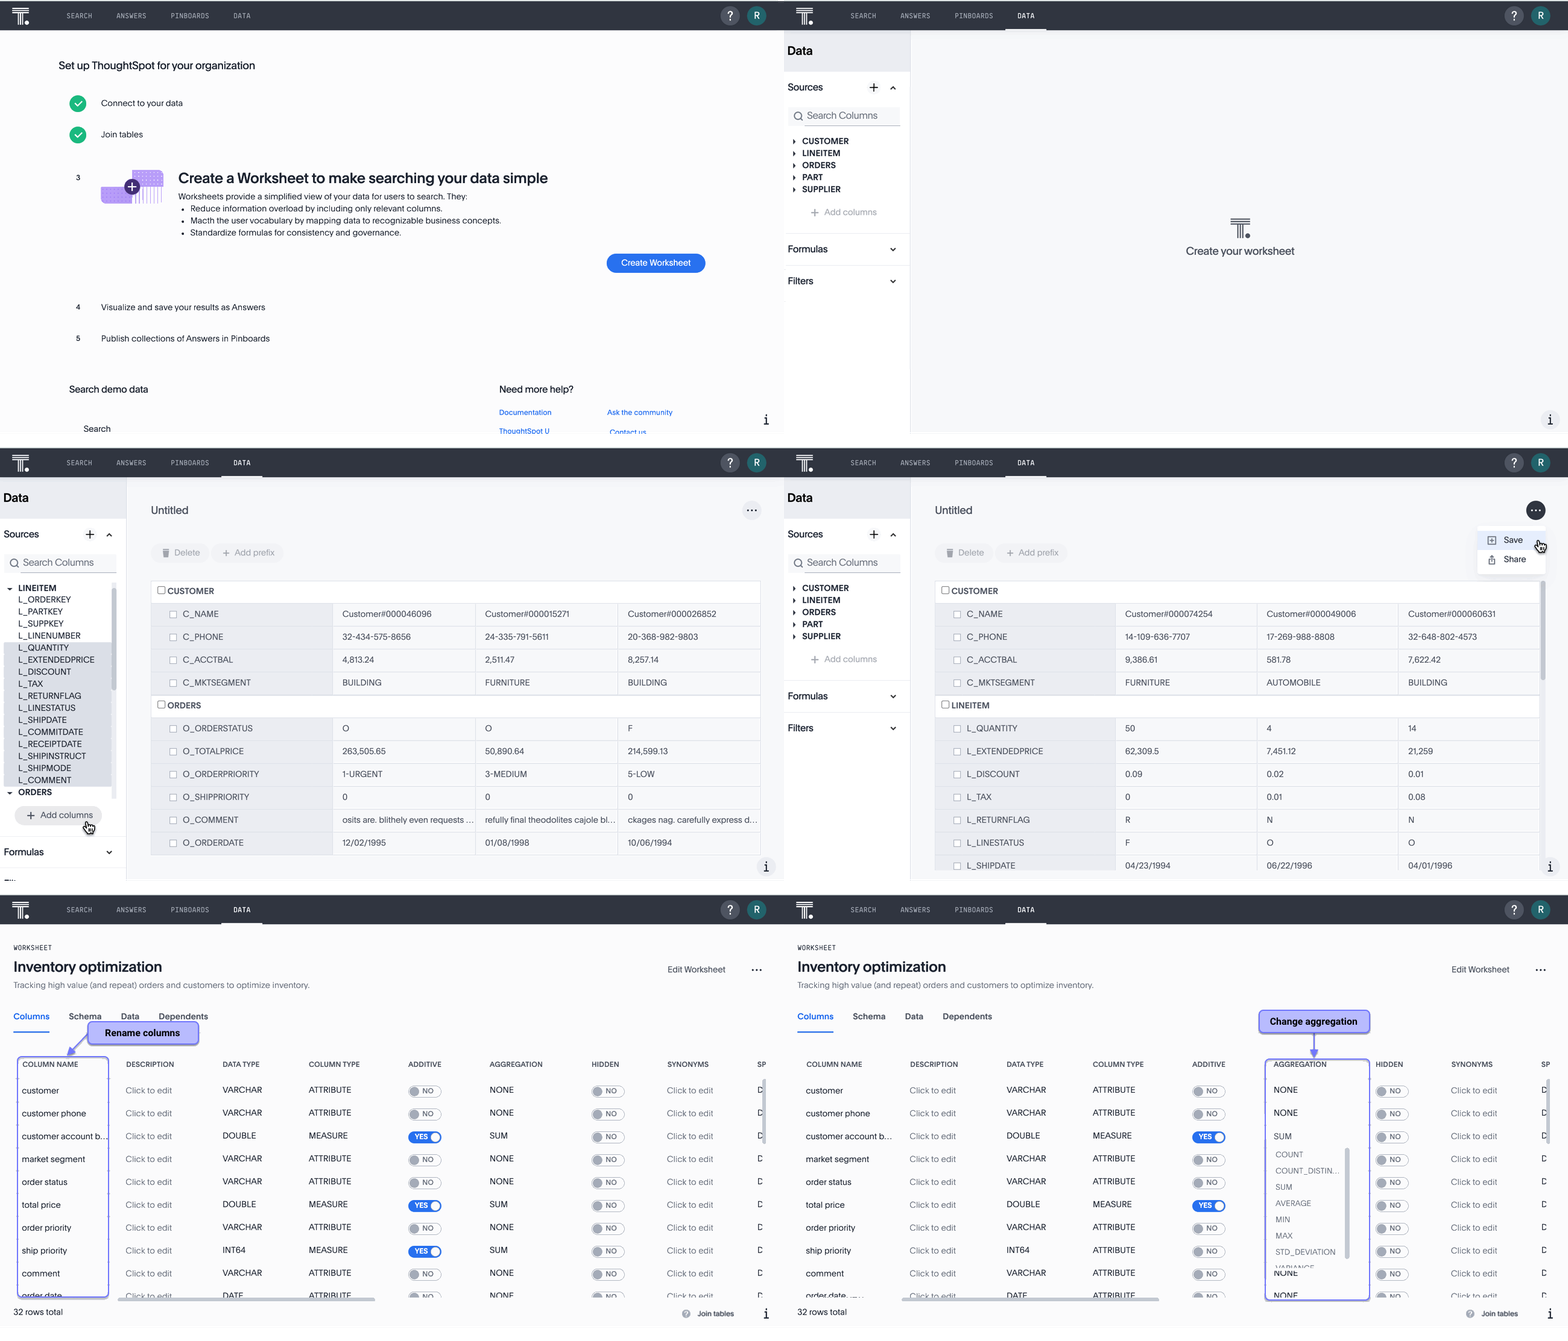
Under Data, see Sources. Select +.
-
The Choose sources interface appears.
It contains the list of tables that in the connection.
-
Select on each table you plan to include in the Worksheet.
-
In the upper-right corner of the interface, select Close.
-
Back on the Data interface, under Sources, note that the list of tables you selected appears.
-
Expand one of the tables by selecting the toggle icon.
-
Select the columns to include in the Worksheet.
-
Select + Add columns.
-
Notice that the table and its columns appear on the main pane of the interface.
-
Repeat for each table you plan to include in the Worksheet.
You can always navigate to a table you identified, and change the column selections.
-
After you finish selecting the tables and columns, click the More menu
 at the upper right corner of the interface.
Select Save.
-
In the Save Worksheet interface, enter the following values:
-
Name is the name of the Worksheet. You can select it as a data source in your searches.
-
Description is optional; we recommend that you identify the supported use case here.
Select Save.
-
-
Congratulations! You now have a Worksheet to use as a data source for Searching and building standard formulas.
-
The Worksheet details page appears. Review your Worksheet, and make any additional changes you would like. Note that if any of your columns contain aggregate formulas, or if your Worksheet contains a chasm or fan trap, ThoughtSpot does not show data samples.
-
We recommend that you customize the Worksheet in the following manner:
-
Rename columns to make them user-readable.
-
Change column type default settings of numeric fields from measurement to attribute, when these numbers represent categorical information instead of measurements that are aggregated.
-
Change aggregation function for measurement columns. For example, columns that track life expectancy should use
AVERAGEorMAX, and never useSUM.
-
Next, you can proceed to Visualize Search results as Answers.
Additional resources
As you develop your expertise with developing and customizing Worksheets, we recommend the following ThoughtSpot U courses:
See other training resources at ThoughtSpot U.


