ThoughtSpot Software Documentation
ThoughtSpot Software is our original offering that you deploy and manage yourself. For details on all deployment options, see ThoughtSpot Software Deployment.
Find topics for the common types of ThoughtSpot users.
What’s new in ThoughtSpot Software
October 2023 9.5.0.sw
| Features marked as Beta are off by default. To enable them, contact ThoughtSpot support. |
Contextual change analysis
You can now identify the key change drivers for changes in your metrics in a KPI chart. Select the percent change label or select any two data points on the KPI sparkline to view change analysis on your top 5 columns by usage-based ranking (UBR) and identify the reason behind the observed change. You can view the changes in other columns by clicking Manage attributes and selecting the desired column(s).
For more information, see Contextual change analysis.
Mandatory Liveboard filters
Mandatory Liveboard filters are now GA. Mark certain filters in your Liveboard as mandatory. If you add mandatory filters to a Liveboard, the visualizations will only load after Liveboard viewers select values for the mandatory filters. Use mandatory filters for Liveboards that contain data that may not be relevant for everyone who must view and consume the Liveboard. Mandatory filters also lower query and performance costs.
For more information, see Mandatory Liveboard filters.
Keywords "of" and "percentage of" Beta
To enable business users to answer questions related to mix, contribution, share of, percentage, and total ratios, we added the keywords “of” and “percentage of”. These keywords help answer questions such as “What is the share of a certain store’s sales as a percentage of the regional whole?” Previously, searches such as these required the use of a group aggregate formula, which presented a barrier to users. For more information, see Keywords: Of and Percentage of. This feature is off by default. To enable it, contact ThoughtSpot support.
Verified Liveboards
Admin-assigned verifiers can now mark Liveboards as verified. Users can now request these verifiers to review their Liveboards, and verify if the information displayed is trusted content. Verified Liveboards carry a tag that signifies that they have been audited for correctness. For more information, see Verified Liveboards.
New data panel GA
The new data panel experience is GA in this release. This is part of the Data Fluency feature. This feature is disabled by default. To enable it, go to your ThoughtSpot user profile and set the Answer data panel experience to New experience. See Choose a data source.
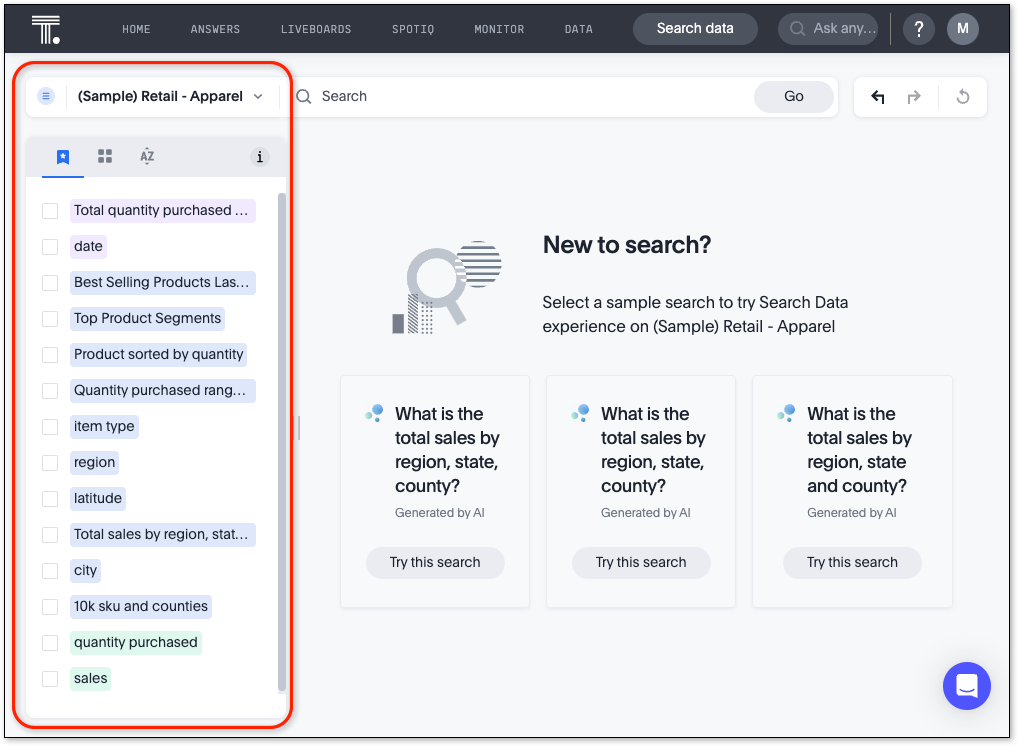
Column and data source overview in Search Data
With the new Answer data panel experience feature enabled, the Search data page displays a short description of your selected data source or column, which helps you understand the kinds of answers you can expect to get when searching. See Start a new search.
Specify default connection for CSV uploads
Previously, when multiple database connections were configured to receive CSV uploads without a specified table or worksheet for collocation, the files were randomly uploaded to one of the connections. With this new enhancement, administrators and data managers now have the ability to specify a default target connection for such uploads.
To set the default target connection, navigate to Data > Connections, click the More menu icon ![]() , select Configure data upload, and click the Enable data upload toggle to on. Next, select the Set as default CSV upload destination toggle. By specifying a default connection, you ensure that CSV files without a designated destination will be uploaded to the chosen connection.
This enhancement provides better control and organization of CSV uploads, making it easier to manage data in scenarios where end-users do not select a co-location for their uploaded files.
, select Configure data upload, and click the Enable data upload toggle to on. Next, select the Set as default CSV upload destination toggle. By specifying a default connection, you ensure that CSV files without a designated destination will be uploaded to the chosen connection.
This enhancement provides better control and organization of CSV uploads, making it easier to manage data in scenarios where end-users do not select a co-location for their uploaded files.
Editing in-use parameters
When using a parameter in a Search, Answer, or Liveboard, you can now change the allowed values type (for example, from List to Range). You can also add or delete values from a list parameter while it’s in use, or increase or decrease the minimum and maximum values in a range parameter. We do not support changing the data type of the parameter (for example, from INT to DATE). For more information, see
Create parameters.
Pivot table enhancements
We made the following enhancements to pivot table charts:
-
When you download an xlsx version of a pivot table, the measure values are displayed as numbers instead of the general format.
-
When you download an xlsx version of a pivot table, row and column labels are shown as separate cells rather than as a column-separated list.
-
You can no longer add conditional formatting to a pivot table in heatmap mode.
-
Naming of subtotals and grand totals are now consistent in the chart and chart configuration dropdown.
-
We now support hyperlinks in pivot tables.
-
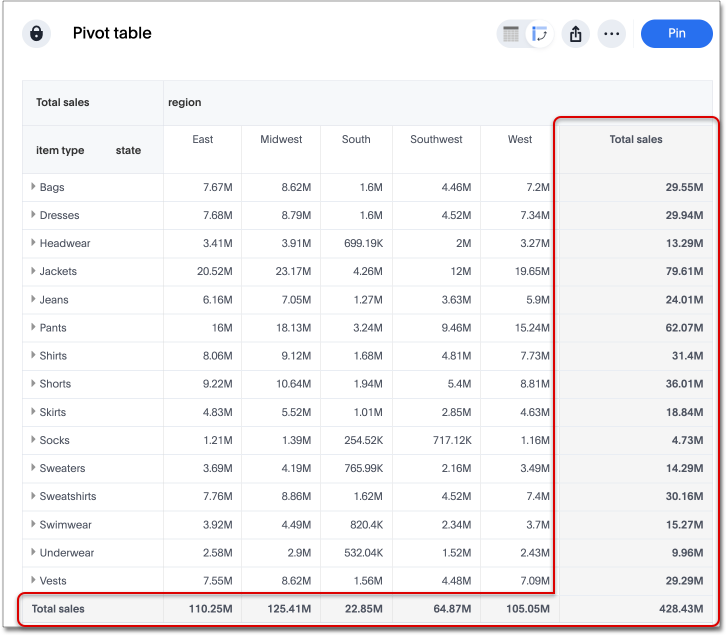
You can now choose to show or hide row and column summaries and subtotals, from the chart configuration menu. When summaries and subtotals are enabled, you can choose to display them at the top or bottom of the pivot table.
Liveboard tabs in Mobile app
We now display Liveboard tabs in the ThoughtSpot Mobile app. To create a Liveboard tab, you must access ThoughtSpot in a browser.
Mobile app load more button
When using ThoughtSpot Mobile, you can now press the Load More button at the bottom of a table to see the next 100 rows of data.
Show onboarding for new users following the share link
When users are invited to ThoughtSpot via a Share link, they can now click the Keep exploring button to be directed to onboarding.
Ability to change legend position
You can now configure the legend position of a chart, or hide the legend. The available options are left, right, above, and below the visualization. To try it out, open the chart configuration menu, select Settings, and choose between Legend on right, Legend on left, Legend on top, and Legend on bottom. You can select the Show legend toggle to hide or show the legend. See Changing charts.
Specify format when downloading charts and tables
We streamlined the file format options when downloading tables and charts from ThoughtSpot. You can download tables in XLSX, CSV, or PDF format, and download charts in XLSX, CSV, or PNG format. To try it out, open a chart or table, and select Download from the more options menu ellipsis icon. For more information, see Download a chart or table.
Custom comparison points for KPI charts
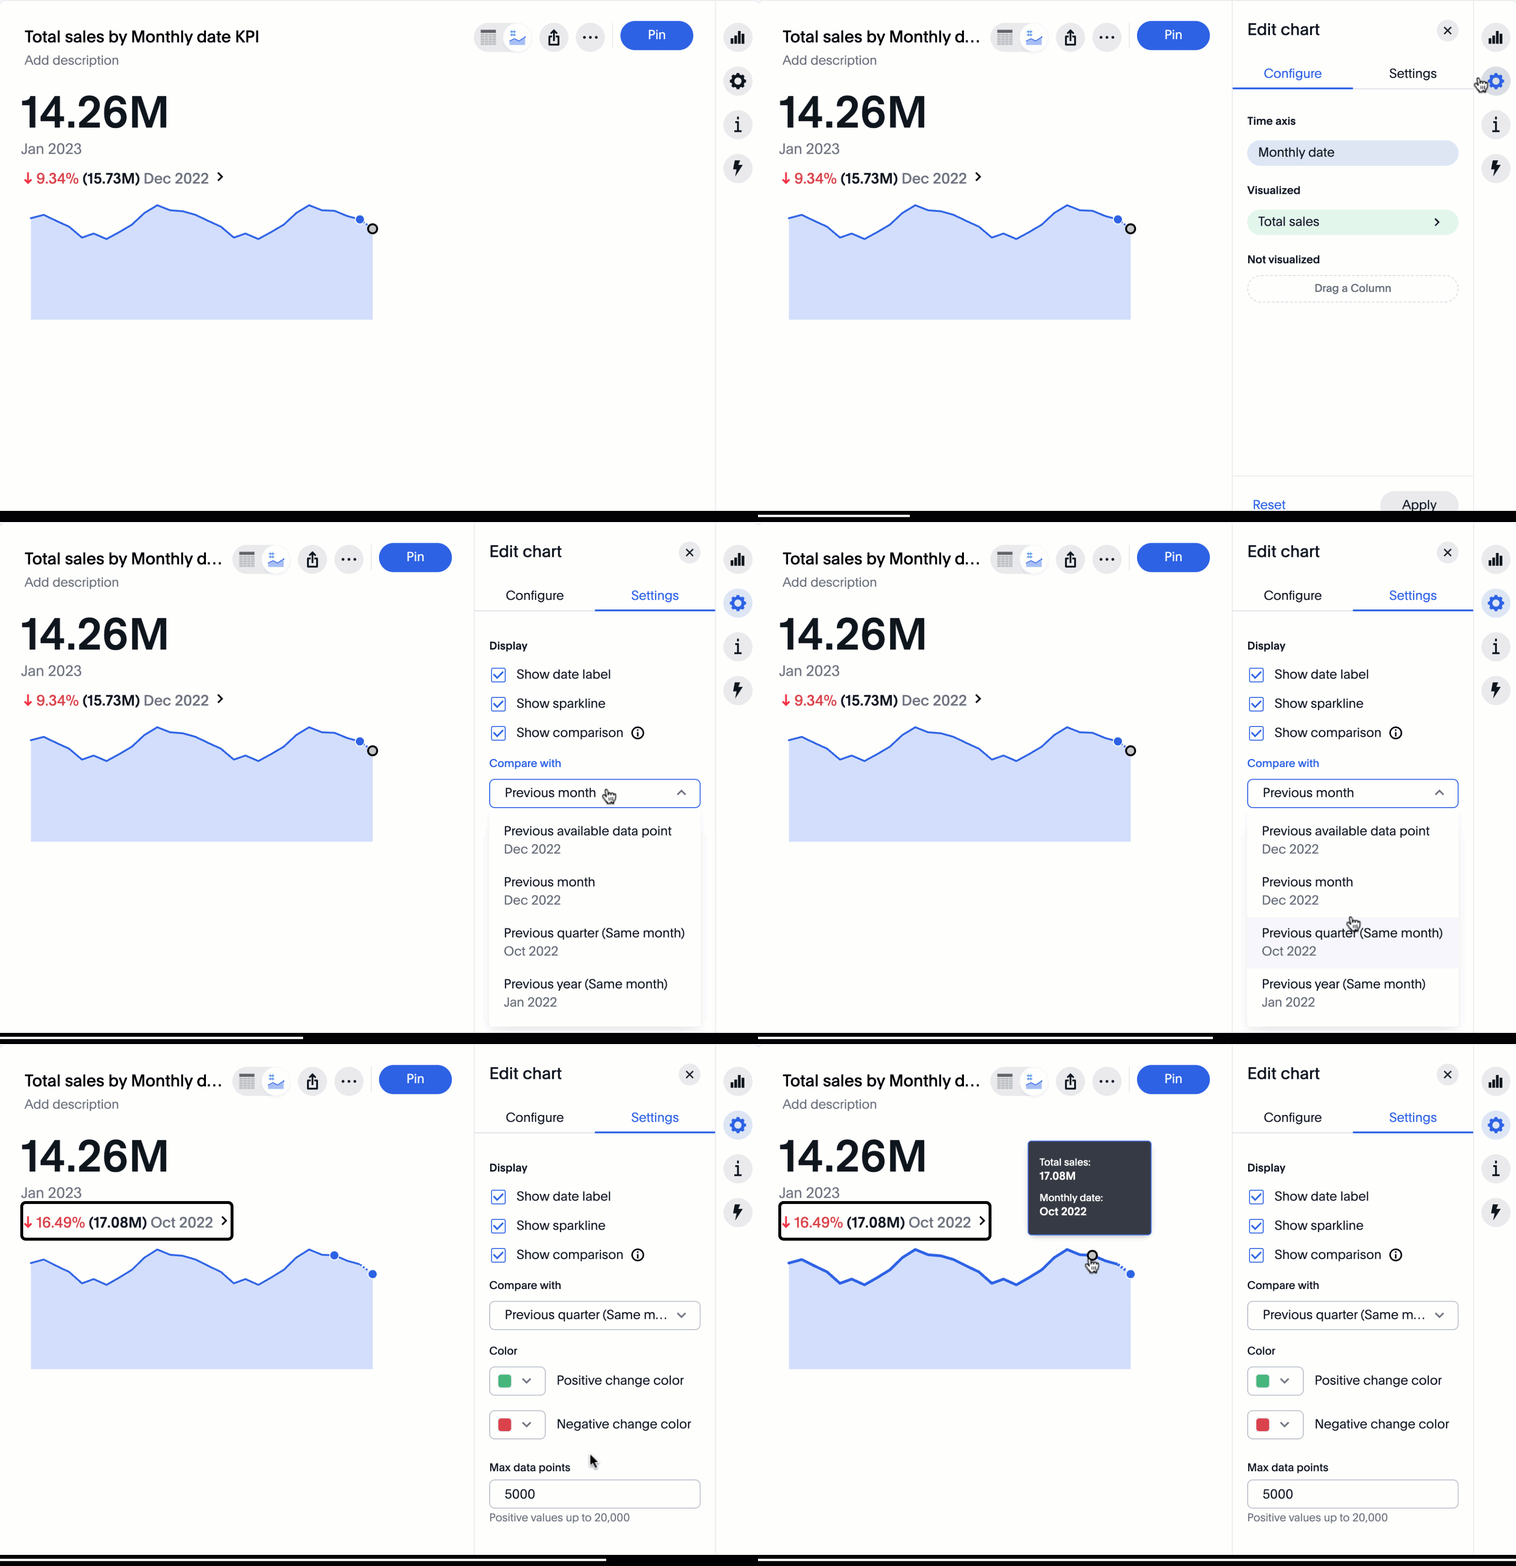
You can now set your KPI chart to display a percent change comparison between the most recent data point and a custom comparison point. For example, when searching for sales monthly, you can choose to see percent change between this month and the previous month, previous quarter, or previous year. For more information, see Custom comparison points.
Liveboard note tiles
The Liveboard note tiles feature is now GA. Add notes to your Liveboards, so that viewers of your Liveboards can quickly understand how to use the data and visualizations you gathered. Note tiles can provide an overview of a Liveboard or visualization, company branding through images, definitions of terms used in the Liveboard, and so on. With the GA of the note tiles feature, you don’t need a specific privilege to upload images. See Liveboard note tiles.
Chart display enhancements
When you create bar and column charts and slice by color, ThoughtSpot automatically enables gridlines to make the chart easier to read. You can choose to disable gridlines under the chart configuration menu.
Upload custom geo maps
Upload your own custom maps and visualize data on geo charts with regions that are specific to you and your organization.
For more information, see Upload custom geo maps.
Geomap chart enhancements
ThoughtSpot now supports the following enhancements for geomap visualizations:
-
We now provide geomap data for all countries. For a full list, see Openstreetmap supported countries.
-
We now support multiple levels of subdivisions within a country, rather than just city and zip code.
-
We now support visualizations comparing subdivisions of multiple countries in a single visualization. For example, if a selected column contains data from cities in the United States and Mexico, all data would be displayed on a single visualization.
To enable these features, the Geo config property in the underlying Worksheet must be set to Auto select.
For more information, see Geo chart enhancements.
Scheduled or downloaded Liveboard PDF width
By default, scheduled and downloaded Liveboard PDFs now render at a width of 1920 px. This ensures that most Liveboard PDFs you download or schedule look the same as the Liveboards you see in ThoughtSpot. You can also change this default width to a different width for your company, by contacting ThoughtSpot support. See Download a Liveboard as a PDF and Schedule a Liveboard job.
Change filter order for Answer filters
Change filter order for Answer filters Arrange Answer filters in the filter bar so that they are in a logical, coherent order, by dragging and dropping them to different spots in the list. This makes it easier for viewers of the Answer to understand and use the filters on the Answer. For more information, see Change the filter order.
Change filter order for Liveboard filters
Arrange Liveboard filters in the filter bar so that they are in a logical, coherent order, by dragging and dropping them to different spots in the list. This makes it easier for viewers of the Liveboard to understand and use the filters on the Liveboard. For more information, see Change the filter order.
Attributes in pivot table cells
Attributes in pivot table cells You can now include attributes in the pivot table cells as well as measures. This is useful for cases when you want to summarize text data such as user role, pass/fail, or other attributes. For more information, see Pivot table charts.
Liveboard header visible when you scroll down
When you scroll down in a Liveboard, the Liveboard name, menu options, and filter and tab bars remain visible. You don’t need to scroll back up to the top to edit the Liveboard or check if you’re filtering by a specific store. You can see the filters or parameters applied to the Liveboard, select the Edit button or more options ![]() menu, and view which tab you’re on from any spot in the Liveboard.
menu, and view which tab you’re on from any spot in the Liveboard.
Parameters
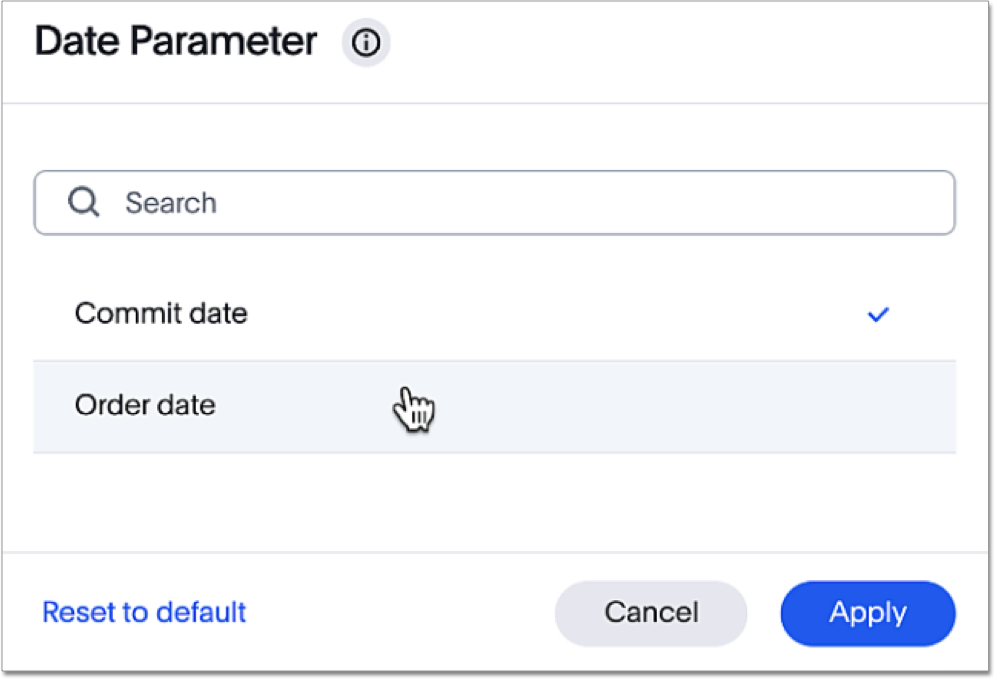
The Parameters feature is now GA. Any user can now create Parameters at the Answer level to optimize their data inquiries. Analysts can also create Worksheet Parameters that are available to all Worksheet users. Use Parameters to run different scenarios with adjustable values, without creating or modifying the constants in formulas for each new value. For example, easily adjust the attribute in an Answer to view your revenue by commit date or order date, as in the following image. To try it out, navigate to any Answer, search, or Worksheet, and select the + button next to the Parameters section in the left panel. For more information, see Creating Parameters and Using Parameters.
Custom groups Beta
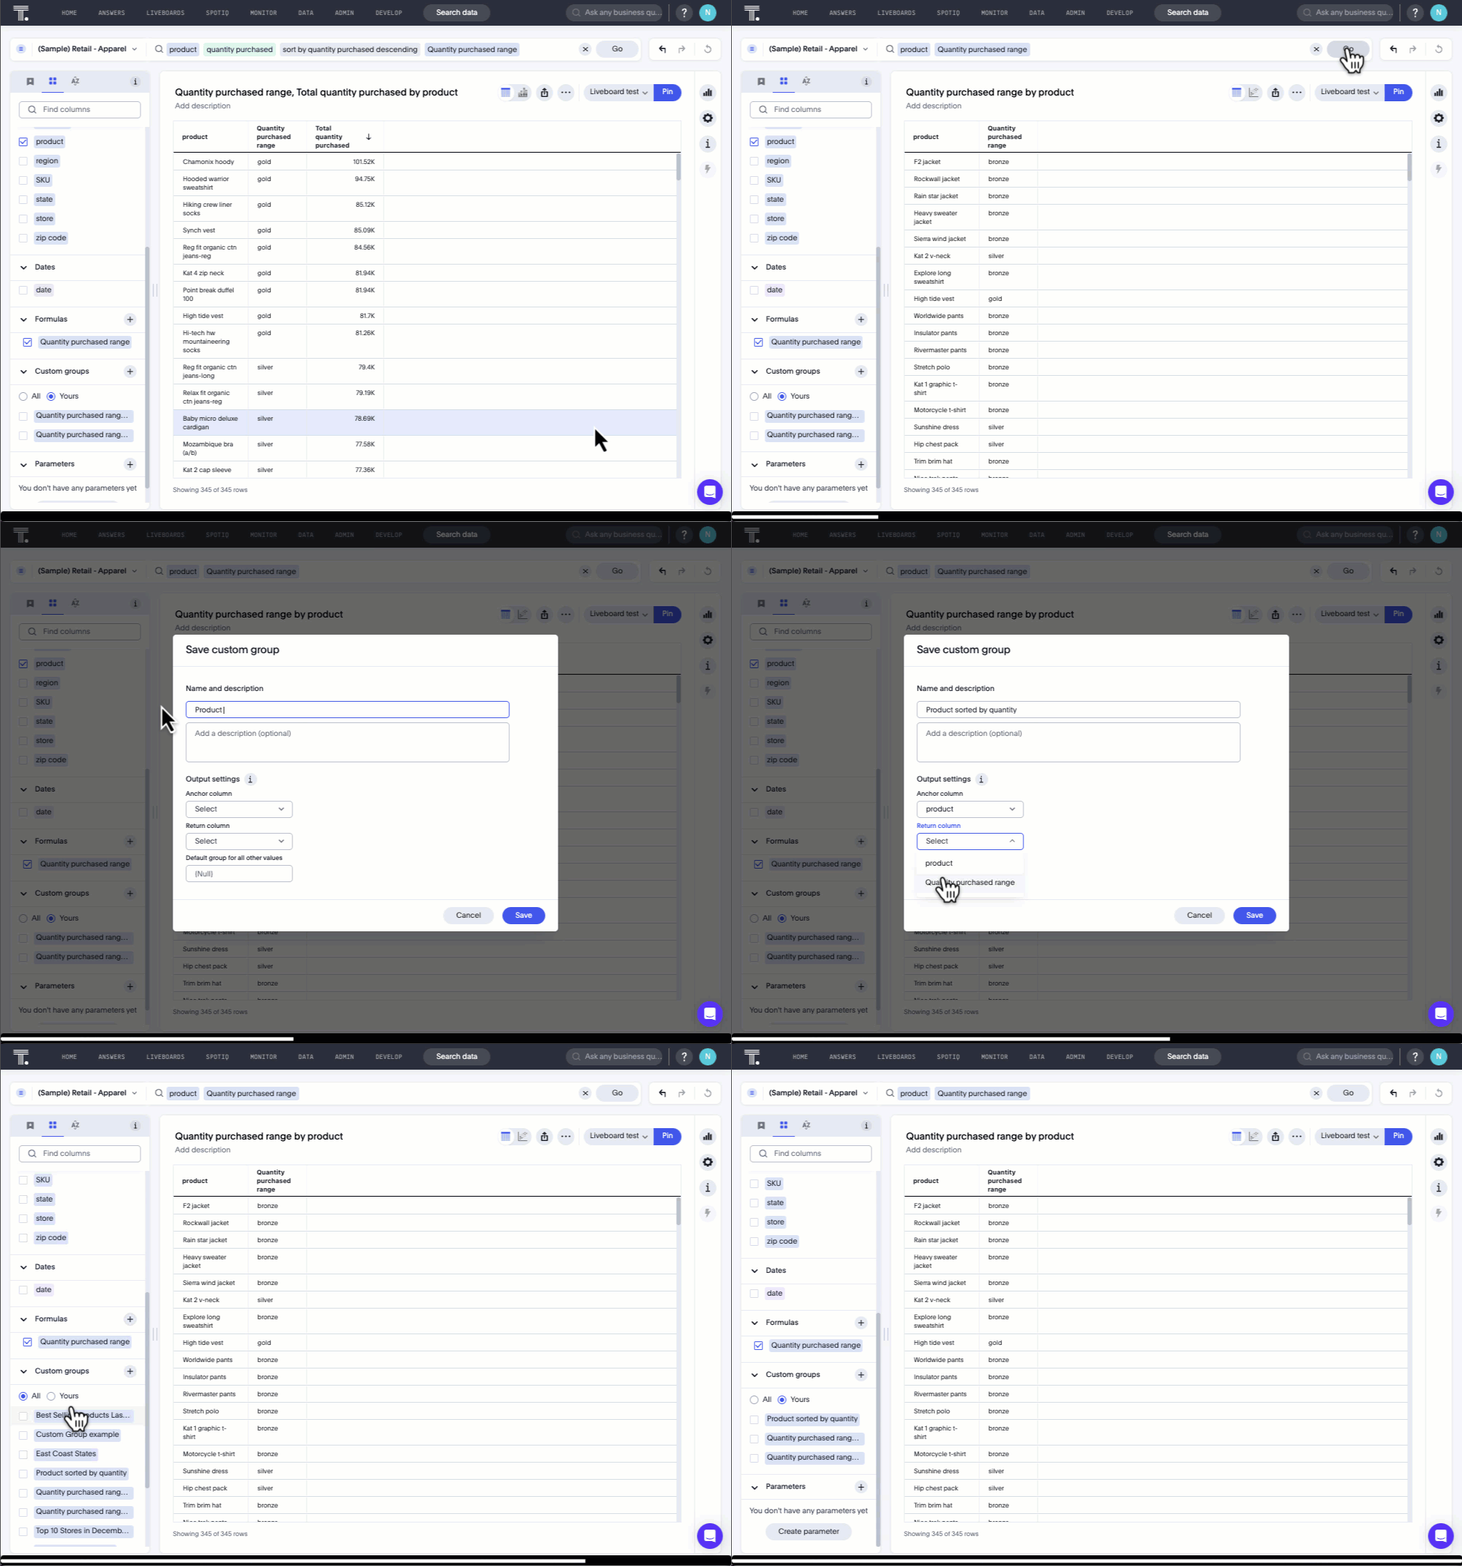
You can now create custom groups, which can be used to classify values in a list you can then reuse across multiple analyses. As an example, you can use custom groups to search for which products are most popular, and define them by sales volume as “gold”, “silver”, or “bronze” level products. Custom groups are community objects which remain when you navigate away from the Search Data page and can be viewed by any user with view access to the underlying Worksheet.
For more information, see Custom groups.
Date picker enhancement in Search
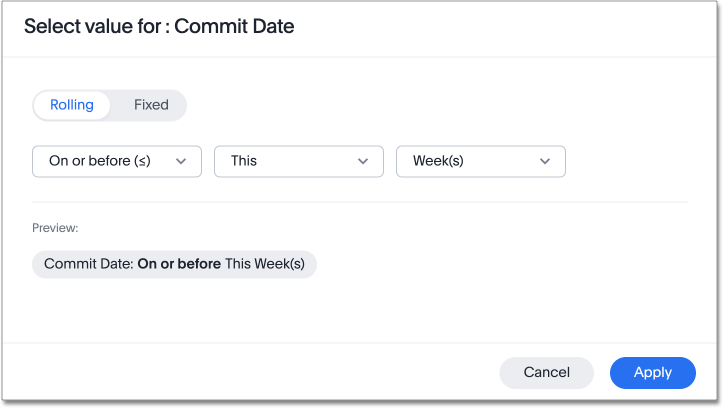
We added support for rolling, fixed, and custom date filters when creating an Answer or filtering a Liveboard. Previously, when adding a date filter to a Search, ThoughtSpot supported the conditions ON (=), ON OR AFTER (>=), BEFORE (<), and BETWEEN. Now, you can additionally filter for ON OR BEFORE (<=), NOT BETWEEN, ON LAST, and ON NEXT.
To try it out, click the filter icon next to the Date column in the left side menu, or click the date filter below the Answer or Liveboard title. For more information, see Date filters for Answers and Liveboards.
Mandatory filters
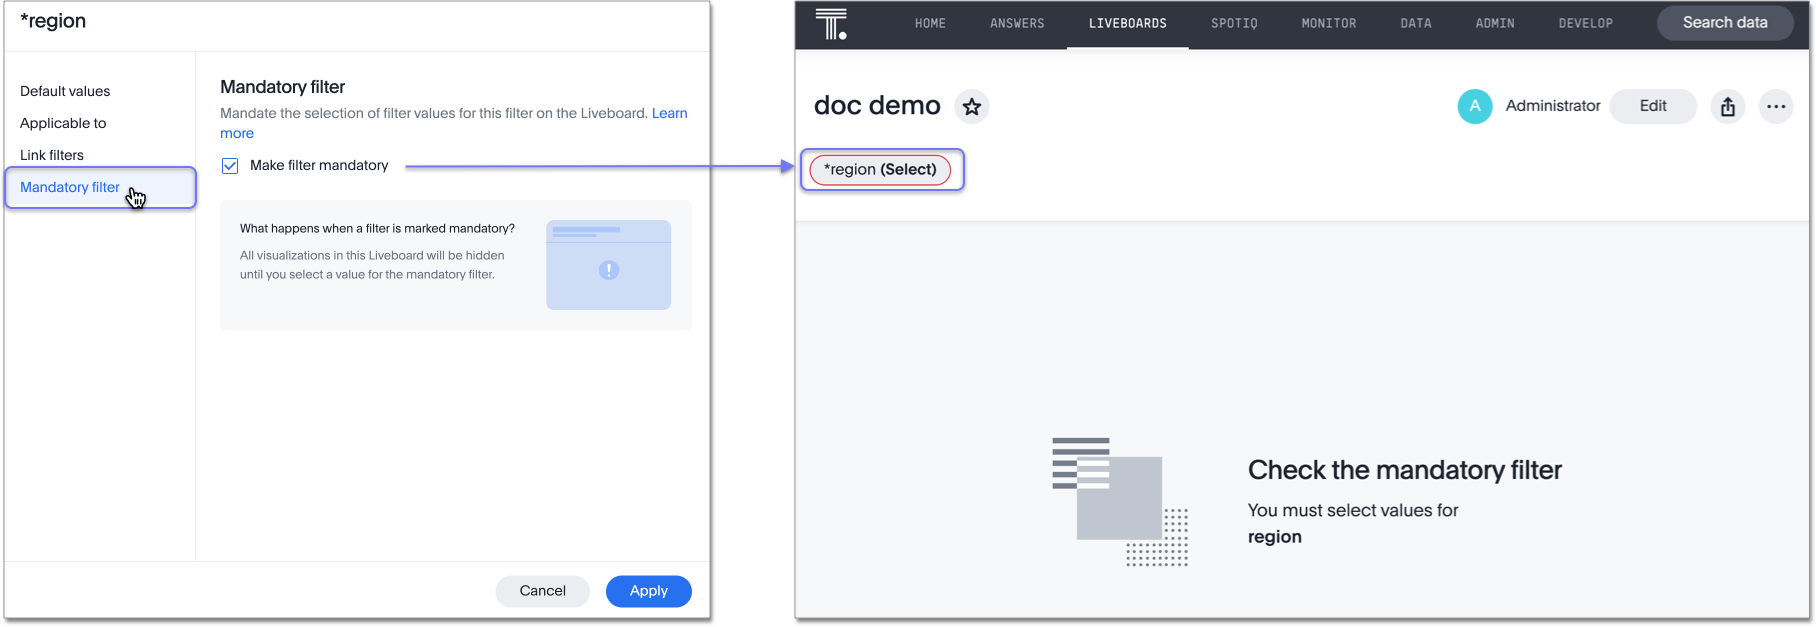
Mandatory Liveboard filters are now GA. Mark certain filters in your Liveboard as mandatory. If you add mandatory filters to a Liveboard, the visualizations will only load after Liveboard viewers select values for the mandatory filters. Use mandatory filters for Liveboards that contain data that may not be relevant for everyone who must view and consume the Liveboard. Mandatory filters also lower query and performance costs. To try the feature out, select Mandatory filter when adding a filter to a Liveboard. For more information about mandatory filters, see Mandatory Liveboard filters.
Liveboard cross filters
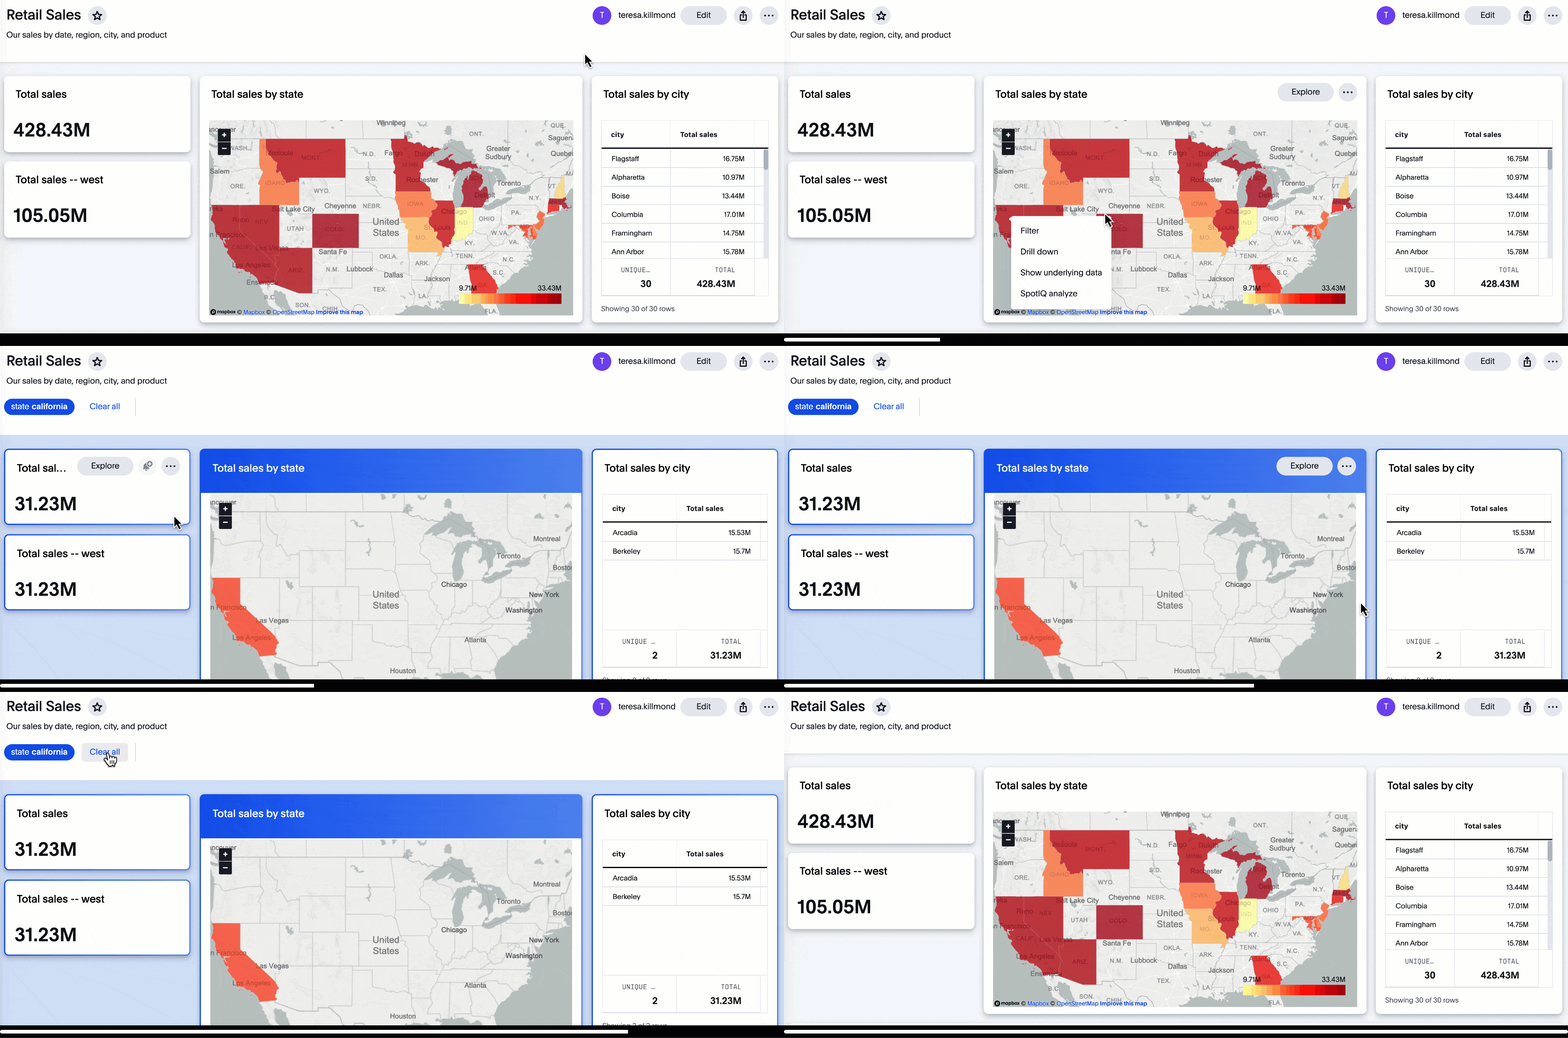
Right-click any data point in your Liveboard and easily filter the entire Liveboard by that value. For example, if you right-click California in a geo chart on your Liveboard, and then select Filter, all the other visualizations only show data from California. A visualization for Total sales by city, for example, would only show sales for cities in California. This feature is also called brushing and linking. To try it out, select any data point(s) in a Liveboard visualization, and select Filter from the menu that appears. For more information, see Liveboard cross filters.
Single value selection for attribute filters
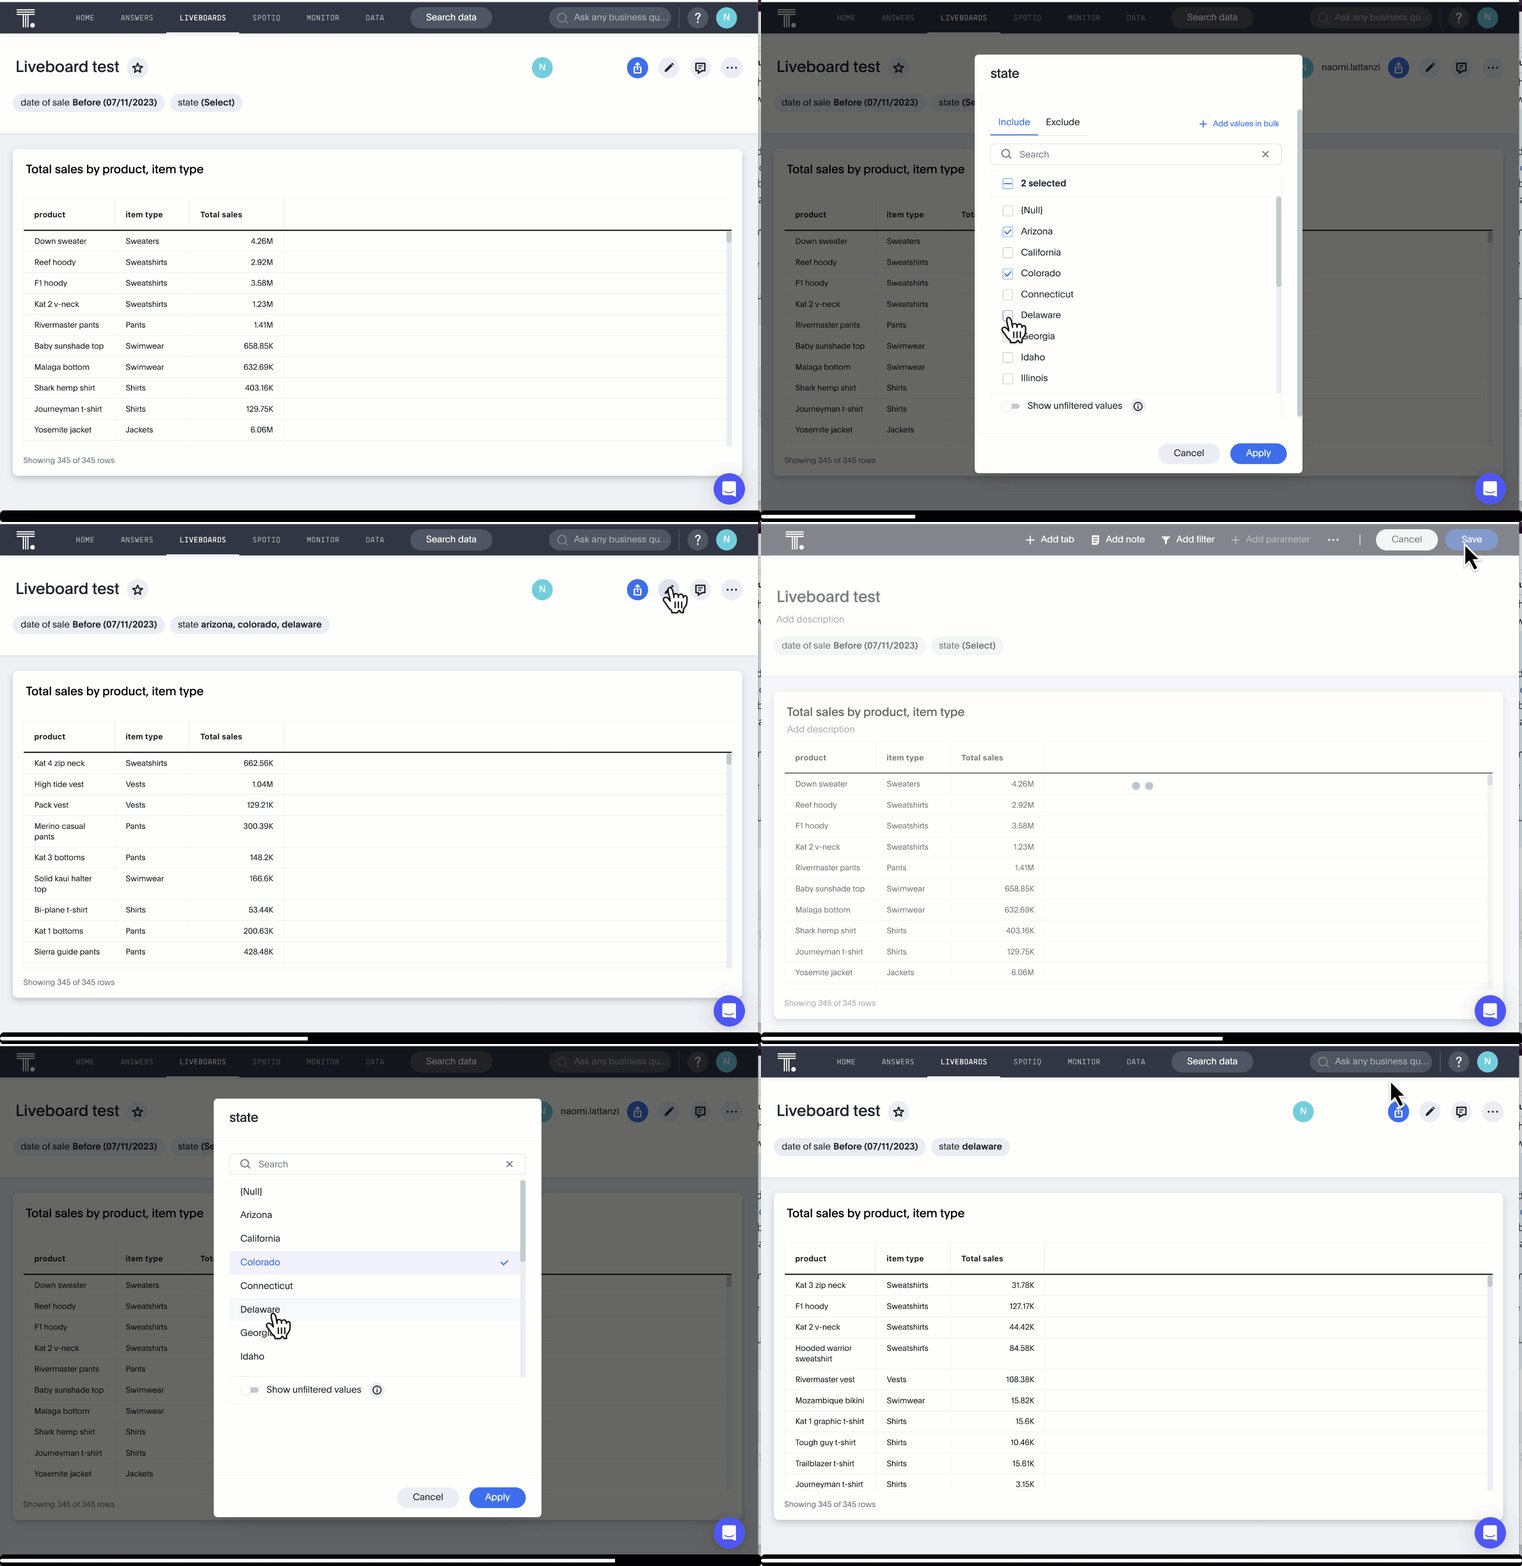
When creating a Liveboard, you can now designate attribute filters as single-select, in addition to multi-select. For example, you could choose to make a Country filter single-select, so users would only see data related to one country at a time.
Show timezone in scheduled Liveboards modal
When scheduling Liveboards, you can now specify your timezone.
Disable heatmap data labels
Optionally disable heatmap charts' data labels, and understand the chart quickly by scanning the heatmap colors. This makes complex heatmap charts with many data values easier to read. See Heatmap charts.
Data labels on a dark background
Data labels on a dark background are now GA and on by default. Labels that appear on a dark background now display in a lighter text color, making them easier to read.
Apply multiple chart changes at once
The apply multiple changes feature is now GA and on by default. In previous releases, every time a user reordered the fields in the chart configuration panel, the chart reloaded. When creating a visualization with multiple fields, users often need to make multiple rearrangements to reach a desired chart. Now users can make multiple configurations and apply them at the same time rather than waiting in between each configuration. For more information, see Reorder labels on the axis or legend.
Remove attached files from scheduled emails
For data security, you may choose to remove attached files from scheduled Liveboard emails. When this feature is enabled, scheduled Liveboard email recipients will receive an email with a link to the Liveboard, which they will need to sign in to see.To ensure that only signed-in users can access your data, contact ThoughtSpot support Support to enable this option. For more information, see Scheduled Liveboards.
Group aggregate enhancements: filters Beta
Group aggregate filter enhancements are GA and on by default. Previously, when using group_aggregate formulas, users could use query_filters to include filters entered in the search bar in the formula’s value, but it was difficult to write a formula that accepted filters from only a single column.
Starting with this release, you can specify column names within the ‘filters’ section of a group_aggregate formula, and any filter in your search bar referencing that column will be added to the formula. Filters entered in the search bar that are not on columns specified in the third argument of the group_aggregate formula will be ignored. For details, see Group aggregation filters.
Group aggregate enhancements: reaggregation Beta
To reduce confusion when using aggregate formulas, the level of detail defined in group formulas is now respected at query level. For example, when trying to calculate the contribution of each store’s sales to the entire region, you might use a group_sum formula, where the sales at store level is divided by the sales at regional level. Your search would include the following columns: Revenue, Customer nation, Regional Revenue formula, and Customer region, where Regional Revenue formula = group_sum(Revenue, Customer Region).
According to the old reaggregation behavior, if a customer removed Customer region from the search bar, the level of detail in the formula would no longer be respected and the formula’s denominator would re-aggregate up to the total. In this case, the formula result would display revenue as a percentage of total revenue, rather than as a percentage of regional revenue.
Under the new aggregation behavior, the formula result will continue to display revenue as a percentage of each region, even if you remove Customer region from the search bar. Visualizations will also display the correct aggregation even if the grouping column is not added to the X-axis.
For more information, see Flexible aggregation functions.
Table column case definition Beta
We are introducing the ability to specify the case of a table column (for example, upper, lower, or mixed). Previously, SQL generated by ThoughtSpot was always wrapped in a LOWER function with no configuration options. Now, users will be able to define whether columns in tables are mixed case or lower case. To enable this feature, contact ThoughtSpot support.
Delete table columns using TML
Remove columns from tables in ThoughtSpot by deleting them in the tables' TML files. To try it out, edit a table TML file, and delete a column’s name and properties. We support deleting a column from a TML file and removing that column’s dependencies in the same zip file import. Note that if the deletion of a column fails, the whole import will fail. For more information, see Deleting columns.
Text keywords enhancements
We improved the syntax of our text keywords, such as begins with and contains, to provide users with more flexibility. For example, the contains keyword now accepts expressions such as product name contains 'shoes' or 'snickers'. See the
Keyword reference.
Additionally, if your query includes two or more contains phrases that modify the same column, ThoughtSpot now combines the phrases using or logic, instead of and. If you have existing Answers or visualizations using this and logic, ThoughtSpot will automatically update your queries after you upgrade, to ensure they return the same information. See the
contains keyword.
Other features and enhancements
Connections
You can now create connections from ThoughtSpot to the following Cloud data warehouses:
Redshift OAuth with Azure AD IDP
Redshift now supports external OAuth through Microsoft Azure AD. See Configure Azure AD external OAuth for a Redshift connection.
Connection error messaging improvements
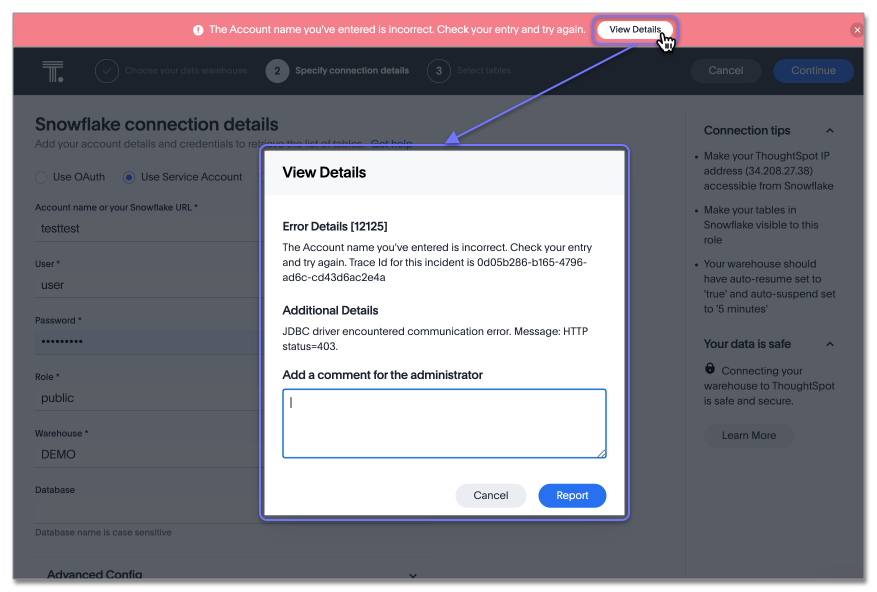
If you run into an error while creating a connection, you can now click View details to see error details and add a comment for your administrator.
Certification of Amazon Aurora and Amazon Relational Database Service (RDS) for PostgreSQL
You can now connect to and query Amazon Aurora and Amazon RDS for PostgreSQL databases.
tscli command updates
We have updated the tscli command syntax to retrieve history. For more information, see tscli get history.
Parameter runtime overrides
Adjust Parameter values at runtime from Liveboard or Answer URLs, or using REST API v1 requests. For more information, see Runtime overrides for Parameters and Runtime Parameters.
ThoughtSpot Everywhere
Customers licensed to embed ThoughtSpot can use ThoughtSpot Everywhere features and the Visual Embed SDK.
To enable ThoughtSpot Everywhere on your cluster, contact ThoughtSpot support.
For new features and enhancements introduced in this release for ThoughtSpot Everywhere, see ThoughtSpot Developer Documentation.


