Google Sheets integration
Overview
Analyst Studio’s Google Sheet integration allows users to connect to their individual Google Accounts to upload Google Sheet data directly into Analyst Studio Datasets for reporting and visual exploration.
Requirements
-
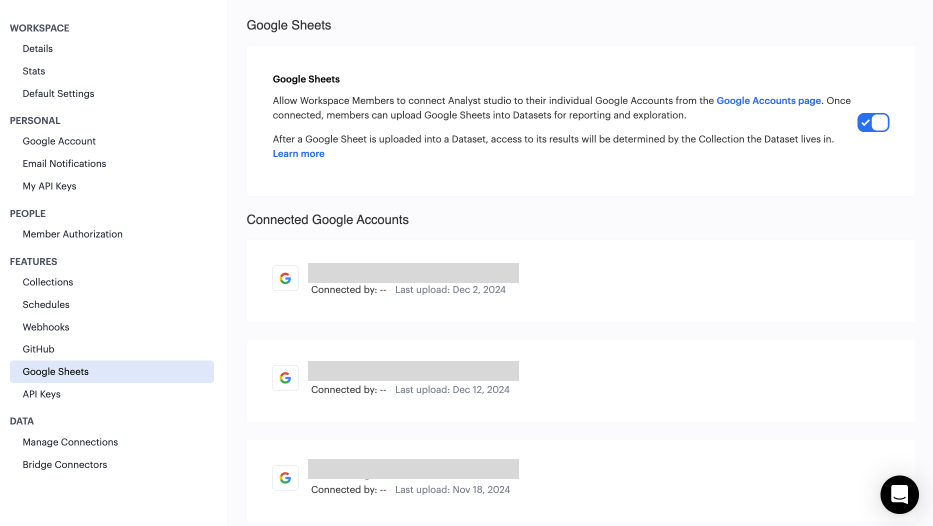
Before you get started, you’ll need to make sure the Google Sheets Integration is enabled for your Workspace. Admins can enable the feature from the Google Sheets feature page in Workspace Settings.
-
Once the feature is enabled, Workspace Members can connect Analyst Studio to their individual Google Accounts from the Google Account page in Workspace Settings.
Tips when preparing your Google Sheet data for use in Analyst Studio
-
Avoid using merged cells, and ensure each cell only contains data (graphs and images won’t be uploaded).
-
Add headers to the first row, as column names will be auto-generated from the first row.
-
Consider using a dedicated worksheet tab to prep and narrow down the scope of your data. When you upload a Google Sheet into Analyst Studio, the entire range is used (including any hidden and filtered cells).
-
Use Google Sheet functions to copy data from one tab to another more quickly. For example:
='Worksheet 1'!A1- copies the contents of cell A1 in Worksheet 1.
Creating a Google Sheet Dataset
To create a new Google Sheet Dataset, select the Create button in the top right corner of your Analyst Studio home screen and choose the Upload a Google Sheet option in the Datasets section.
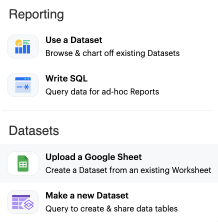
Alternatively, navigate to My Work and click the shortcut tile to Upload a Google Sheet.

This will open up the Google Sheets upload modal, where you can browse for and select individual Google Sheets. If you haven’t connected to your account before, you’ll first be prompted to do so.
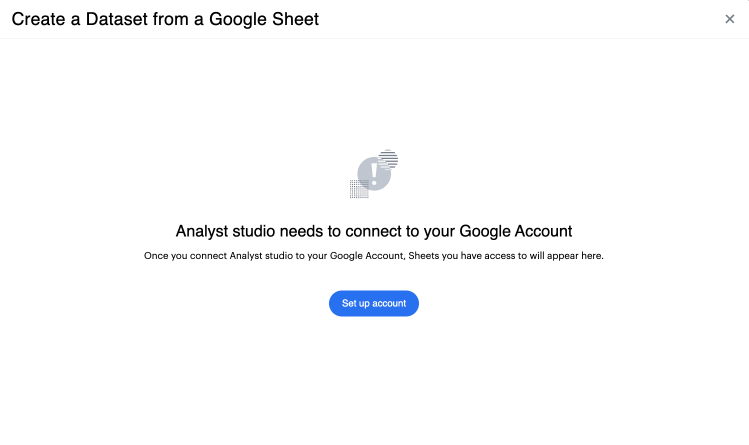
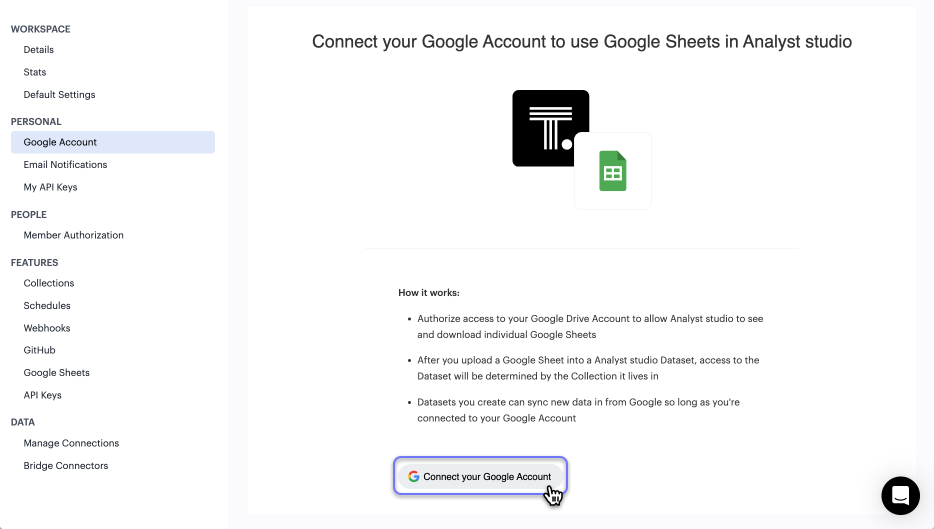
Click on the Set up account button to access the Google Account page in Workspace Settings. From here, you can give Analyst Studio access to your Google Drive account.
| After you upload a Google Sheet into an Analyst Studio Dataset, access to the Dataset will be determined by the Collection the Dataset lives in. Datasets you create can also sync new data in from Google so long as you’re connected to your Google Account. |
Once connected, Google Sheets you have access to will appear in the upload modal. From here, you can browse and search for the Spreadsheet you’d like to use, or paste in its URL. After you’ve selected a Spreadsheet and Worksheet tab to upload, you can also give your Dataset a name and description. When you’re finished, click Create Dataset.
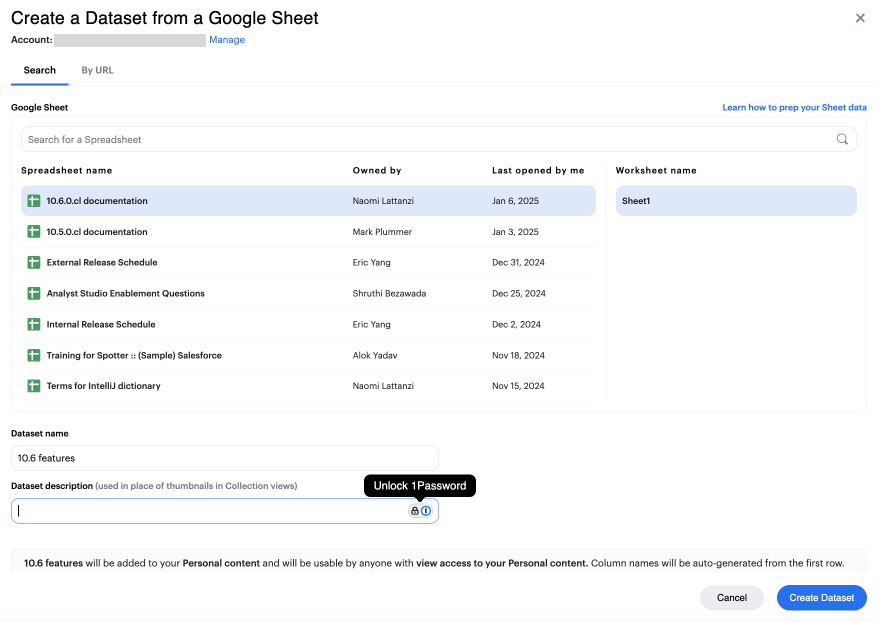
After your Sheet data has been successfully uploaded and your Dataset has been created, you’ll receive a notification that it’s ready for use. From here, you can choose to edit the Dataset directly or start visually analyzing its data in a new Report.

Editing your Google Sheet Dataset
Once your Google Sheet data is uploaded, you’ll be able to see the results in the Data View. This shows you the columns that were generated from the Google Sheet.
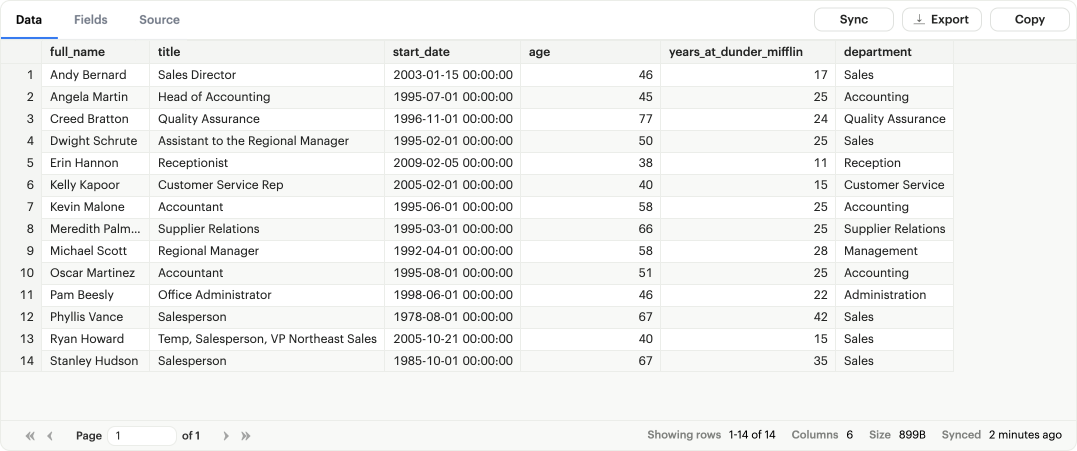
You can also see a list of all of the available fields in the Dataset from the Fields tab.
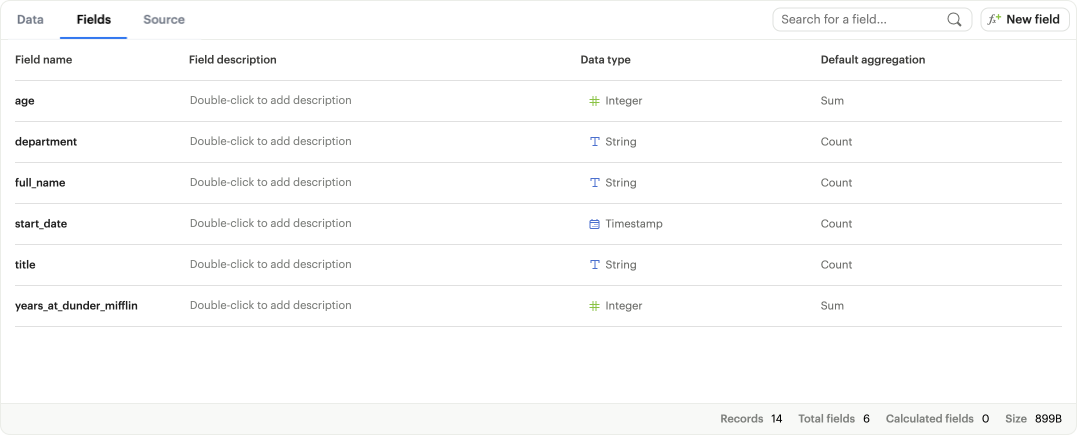
To pull new data in from the underlying Google Sheet, click the sync button.

Describing the fields in your Dataset
We recommend adding field descriptions to all Workspace Datasets to build shared understanding around business and logic definition.
To add a new field description, edit any Dataset and navigate to its Fields tab. From here, double-click on the row you’d like to edit. Descriptions support up to 350 characters, and text formatting such as bolding, italicizing, emojis, line breaks, and hyperlinks.
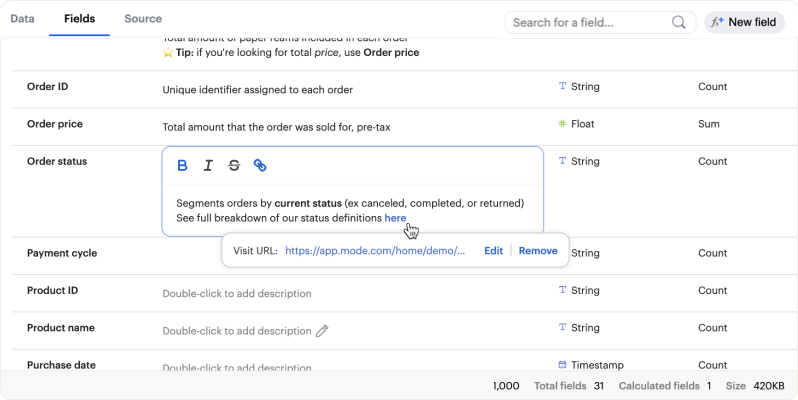
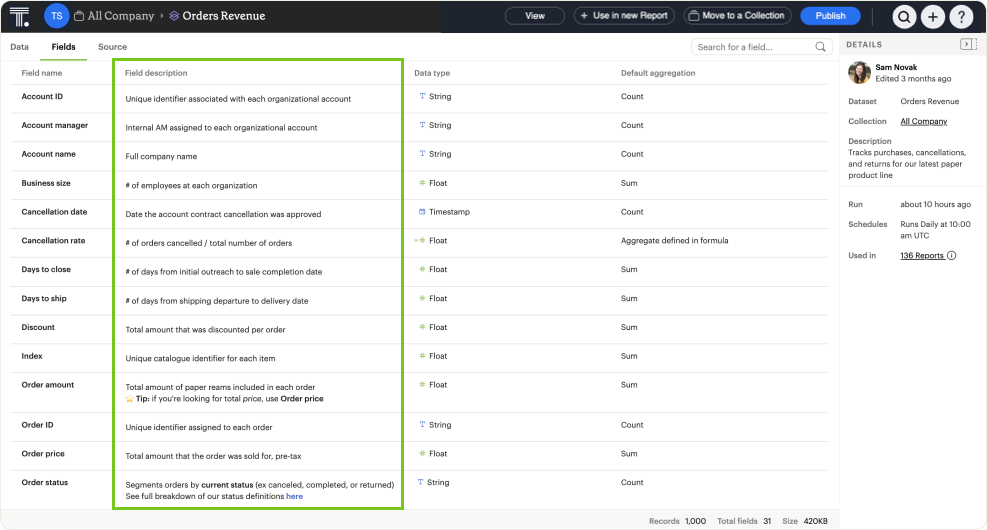
Once added, field descriptions will appear in the Fields tab of a Dataset, and when hovering over the fields list in the chart builder.
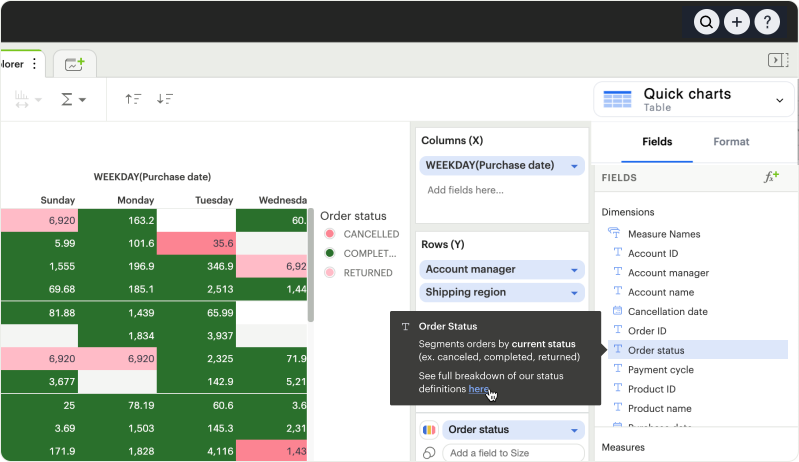
| Field description tooltips have a 250px max width. To see how your description will appear when charting off the data, add your Dataset to a Report and navigate to the given field from within the chart builder. |
Here are some use cases to think about when adding field descriptions to Dataset fields:
| Use case | Sample field | Sample Description |
|---|---|---|
---------------------- |
-------------------- |
-------------------------- |
Shared understanding |
Engagement rate |
Calculates the % of users who are engaged, where engaged is defined as any user who has logged in and taken >1 action in the past 14 days. |
Expectation setting & data previews |
Order status |
Segments ordered by canceled, completed, or returned. |
Disambiguation |
Order amount |
Total amount of order supply placed per order, for example, 8 units of paper. |
Education |
Total signups |
Shows the total number of signups by week for every single row. |
Adding calculated fields to your Google Sheet Dataset
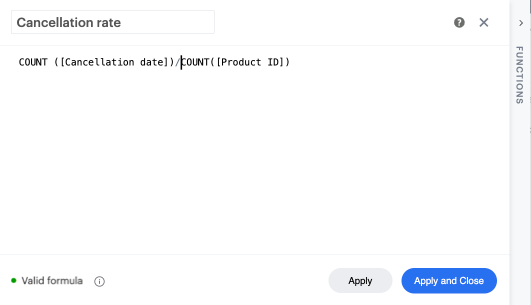
You can add new calculated fields to the Dataset from the Fields tab. Doing so will add the calculated field to the list of available fields, and also make it available in any reports created from the Dataset.
To add a new calculated field, first select the New field button.

Then enter the formula for your calculated field, along with adding a name. To save the calculated field, select the Apply & Close button.
Viewing source information
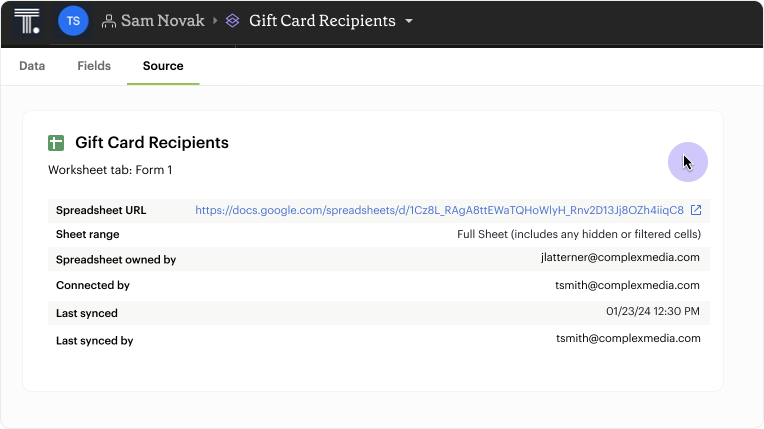
Information about the underlying Google Sheet that was used to generate the Dataset can be accessed from the Source tab.
Updating your Dataset’s name and description
You can change the name and description for your Dataset at any point. To do so, select the caret next to the Dataset name in the header. From the dropdown, select Rename.
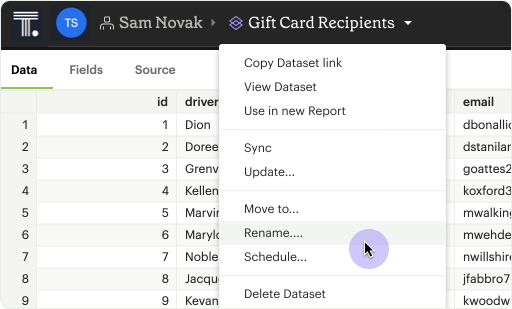
Enter the desired Dataset name and description. Then select Save. We recommend using consistent naming conventions and adding detailed descriptions to your datasets. Doing so will help other team members find and understand how to use the Dataset.
Scheduling a Google Sheet Dataset
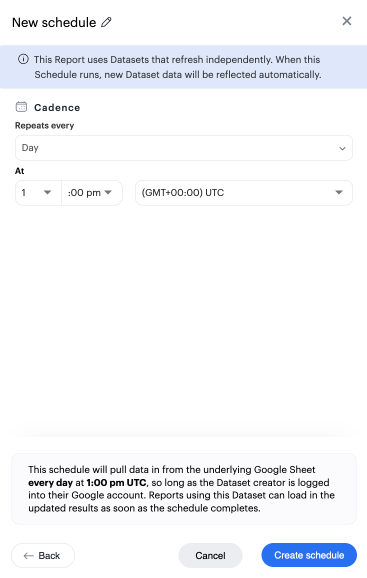
You can set a schedule for your Dataset to sync in data from the underlying Google Sheet on a cadence. After a Google Sheet Dataset finishes syncing, all associated Reports built using the Dataset will be able to pull in the fresh data.
To create a new schedule, select the caret next to the Dataset name and choose Schedule. Then, select Create New Schedule to open the scheduling options. From here, you can set the refresh frequency, as well as the specific time and timezone.
Moving a Google Sheet Dataset to a Collection
The final step when creating a Dataset is to move it into a Collection. You can think of this action as publishing the Dataset, as it makes the Dataset available for other team members to access and use.
To move the Dataset to a Collection, select the Move to a Collection button in the top right corner of the Datasets editor.
This will open a modal displaying all of the available Collections.
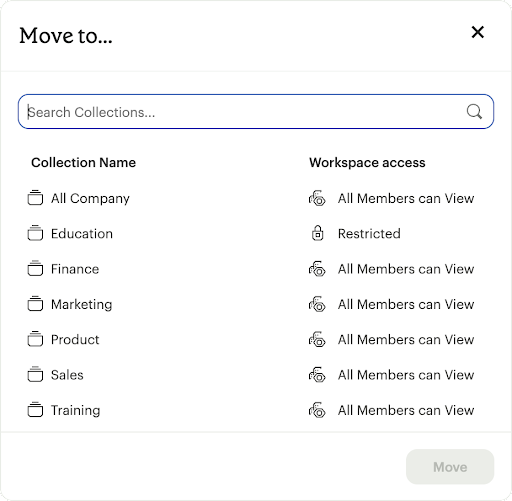
Select the Collection you want to add the Dataset to, then select Move.
Viewing a Google Sheet Dataset
To view a Dataset you’ve just created, select the View button in the top right corner of the Datasets editor.

From here you can view the Data, Fields, and Source tabs, Dataset details, as well as export or copy the data.
In the Details pane, you can see information about the Dataset, including the Collection it lives in, description, when it was last synced, any schedules it has, and which Reports are built from the Dataset. To view a list of Reports created from the Dataset, select the Used in link to open a modal displaying all child Reports.
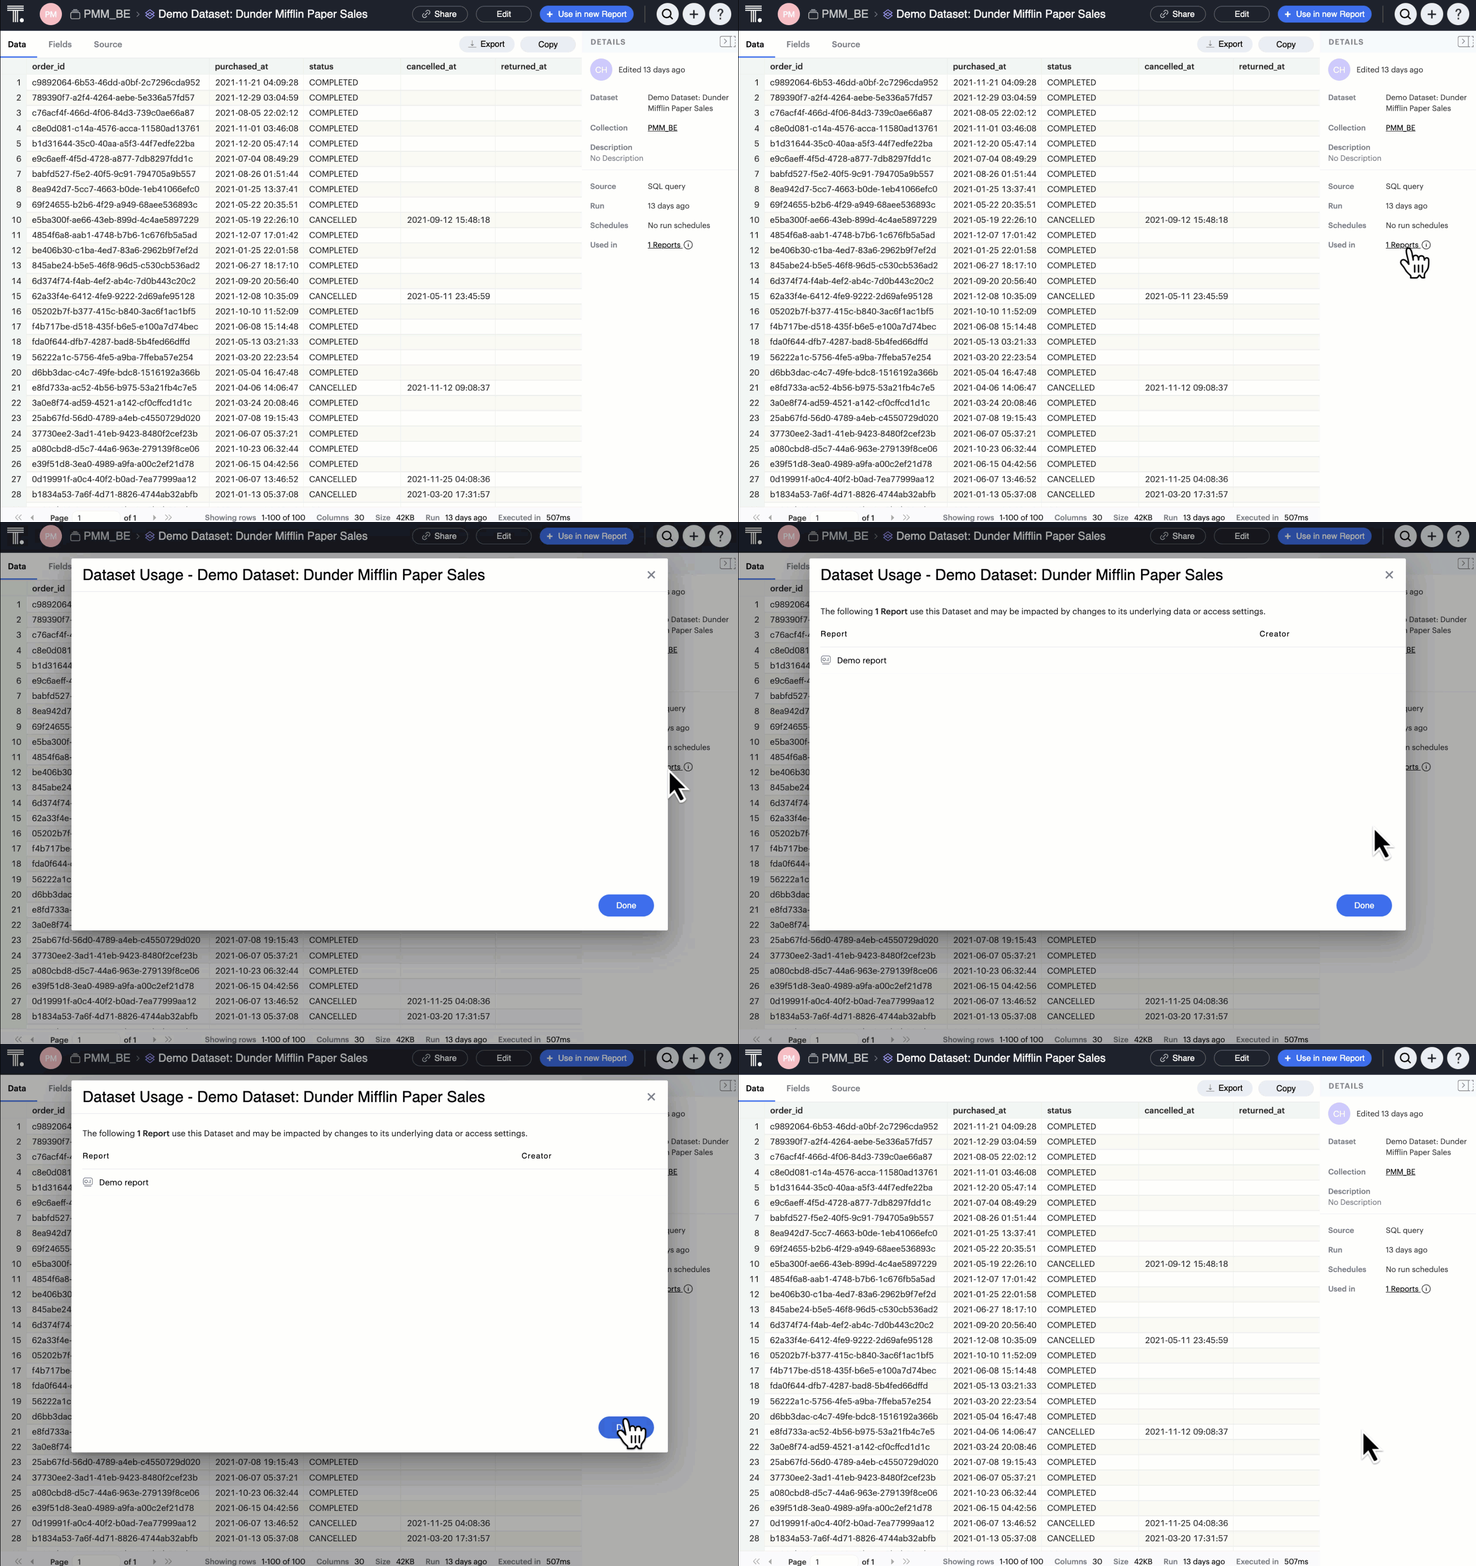
| Reports you don’t have access to will still appear in the count, but will be obfuscated or un-viewable. |
Using your Google Sheet Dataset in a Report
You can add a Dataset to any Report for which you have edit access. There are a few ways to use your Google Sheet Dataset in a Report:
-
After your Sheet data has been successfully uploaded and your Dataset has been created, you’ll receive a notification that it’s ready for use. From here, you can choose to edit the Dataset directly or start visually analyzing its data in a new Report.

-
While editing or viewing a Google Sheet Dataset, click the Use in New Report button located in the header.
-
From within an existing Report, select the + Add Data button located in the left navigation panel. This will open up the Datasets browser so you can search for existing Datasets to add to your Report.
| Personal Datasets won’t appear in the Datasets browser or when searching, and can only be added to existing Reports via URL. To make your Google Sheet Datasets more discoverable, move them to a Workspace Collection. |
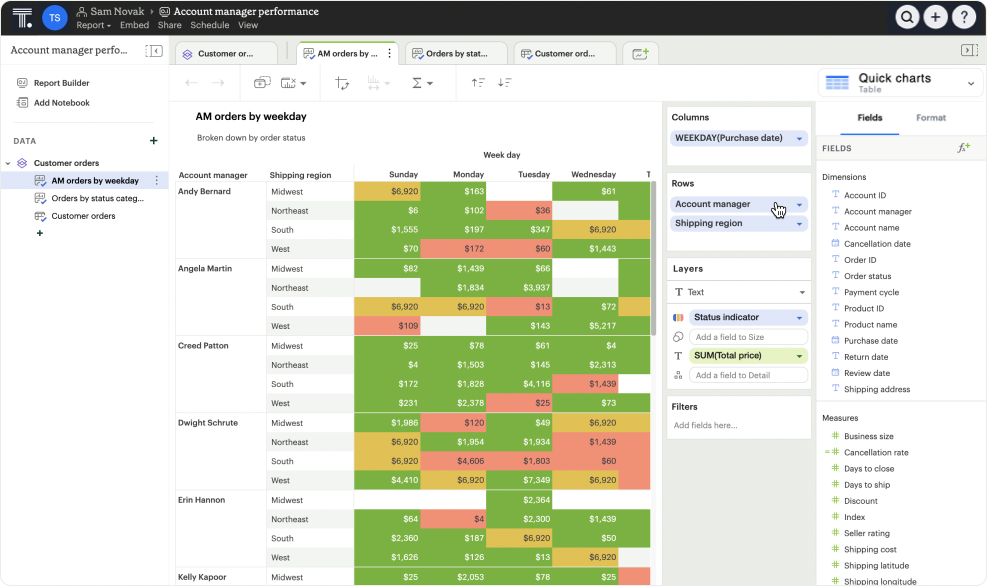
Once your Report is created and the Dataset is added, a flat table visualization will also be created by default. You can filter and sort the data on the table visualization or create additional visualizations using the data in the Dataset.
Refreshing data in a Dataset-based Report
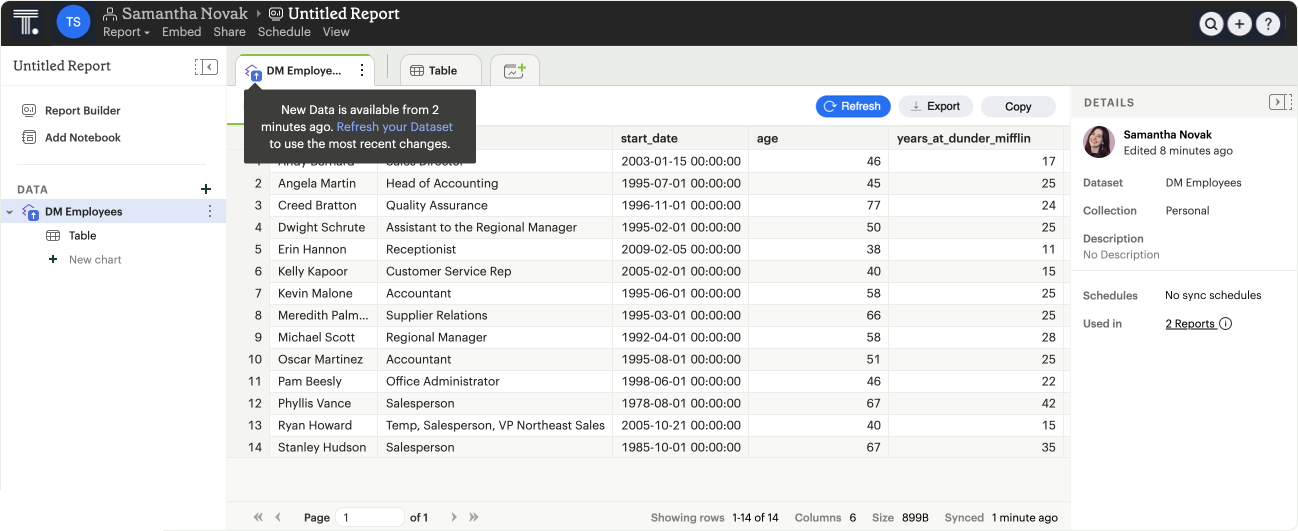
New Google Sheet Dataset data can be synced into Analyst Studio via a Dataset schedule, or manually from within the Datasets editor. When you run your Report or refresh an individual Dataset from within a Report, Analyst Studio will check to see if there’s a newer Google Sheet Dataset sync available, load it in, and snapshot its results within your Report’s run history.
Datasets will be badged in the Report edit view when there is a fresher sync available, so you know when to refresh your Report.
Google Sheet Dataset permissions
After you’ve authorized access to your Google Account, you’ll be able to browse and upload any Google Sheets you have access to in Google Drive.
Once you upload a Google Sheet into an Analyst Studio Dataset, access to the Dataset will be determined solely by the Collection it lives in. Datasets you create can continue to sync new data in from Google so long as you’re connected to your Google Account.
FAQs
Q: Can I access my Google Sheet Datasets in the SQL editor for querying or joining?
No. Currently, reusable Datasets can only be used for visual analysis via Quick Charts and the Visual Explorer. The ability to query and join reusable Datasets is on the roadmap, and will be introduced as a future feature.
Q: Can I access my Google Sheet Datasets as dataframes in the Notebook?
Yes. You can reference Google Sheet Datasets that you’ve added to your Report as dataframes in the Notebook by name, position, or token.
Q: Can I add custom HTML to Reports that are using Google Sheets Datasets?
You can customize the styling of your Report’s layout using the HTML editor, but any custom JavaScript including example gallery code that uses alamode is unsupported for Reports using Google Sheets Datasets.
Q: How big can my Google Sheets Datasets be?
Google Sheet Datasets adhere to your Workspace’s data plan, and follow the same per query result cap. Google also limits the amount of data per Sheet to 10M cells, or up to 100MB.
Q: Can I sync my Google Sheet Datasets to GitHub?
Currently, only query-backed Datasets can be synced to GitHub. There is also a known bug when syncing Reports that contain Google Sheet Datasets to GitHub, causing any Google Sheet Datasets to appear as empty .sql files.
Q: If I make changes to my underlying Google Sheet, how are they reflected in Analyst Studio?
To update your Google Sheet Dataset to reflect any changes made to the underlying Google Sheet, click the Sync button in the Datasets editor or set up a schedule to sync new data in on a schedule.
Q: Can I select a range of data to upload when creating a Google Sheet Dataset?
No. Today, when you select a Google Sheet tab, the entire tab is uploaded (including any hidden or filtered cells). You might consider using a dedicated Worksheet tab to prepare and narrow down the scope of your data.
Q: Can I upload multiple Sheets at the same time?
No, you can only select one Google Sheet tab to upload at a time, as Datasets can only contain a single table.
Q: What happens if I delete a Google Sheet Dataset?
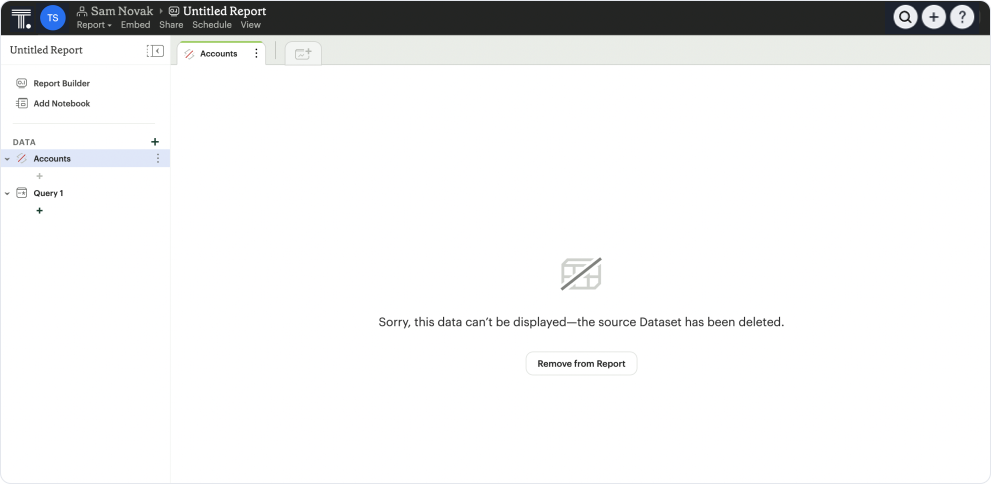
The Dataset will be permanently removed from your Workspace, and any dependent Reports, charts, or calculated fields will break
Q: What happens to my Google Sheet Datasets if I disconnect my Google account from Analyst Studio?
Disconnecting your Google Account will prevent you from creating new Datasets using Google Sheet data until you reconnect.
Existing Datasets built on the connection will continue to use the last successful sync but won’t be able to sync in new data unless you reconnect, which could break existing schedules.
Q: As an admin, what happens to existing Google Sheet Datasets if I disable the Google Sheets integration for my Workspace?
Disabling the Google Sheets integration will log out any members currently connected to Google, and prevent them from re-connecting or creating new Datasets from Google Sheet data.
Existing Datasets built via the Google Sheets integration will continue to use the last successful sync but won’t be able to sync in new data, which could break existing refresh schedules.
Q: Where can I get more information on the Google Sheets integration usage for my Workspace?
You can use Discovery Database to query which Google Sheets Datasets have been created and its sync history.
Two new tables, GOOGLE_SHEETS and GOOGLE_SHEET_SYNCS have been added to the schema.


