The Notebook
Overview
Every Analyst Studio Report contains an integrated notebook-style environment where analysts can extend their analysis using either Python or R.
The Notebook’s movable code blocks and markdown cells enable exploratory data analysis, visualization, and collaboration. Notebook environments have a variety of supported Python libraries and R packages installed. You can add the results of output cells to Reports, or share a link to the Notebook directly. When Notebook output is included in the Report, that Report’s schedule will re-run the Notebook so all of the data stays in sync.
Using the Notebook
You can start using the Notebook in two main ways: directly from the home page to start a new analysis, or from within an existing Report.
Create a Notebook from the home page (Quick Start)
This is the fastest way to start a new Python or R-based analysis. This method automatically creates a new, untitled Report containing a blank Notebook.
-
From the home page, click the + icon to open the Reporting menu.
-
Under the Reporting section, select Use Notebooks.
-
In the sub-menu that appears, you can choose Create blank Notebook to start fresh, or Import Notebook to upload an existing
.ipynbfile (up to 25 MB).
-
-
A new Report will open with a blank Notebook ready for use.
Add a Notebook to an existing Report
Use this method when you want to use the results of your SQL queries as input for a Notebook analysis.
-
Open an existing Report or create a new one.
-
(Optional but recommended) Run one or more SQL queries from the SQL Editor.
-
In the left navigation panel, find the NOTEBOOK section and click the + icon.
-
In the menu that appears, you can choose Create Blank Notebook or Import Notebook.

-
-
If you have run any SQL queries, their results will automatically be loaded into a Datasets object in your new Notebook, making them immediately available for coding.
Toolbar
Main Toolbar
-
Run All - Runs all input cells in the Notebook in sequence (from top to bottom).
-
Restart - Stops any current computations running in the Notebook.
Restarts the session, thus clearing all the variables, libraries imported, etc., that were defined. However, code in input cells will be available to re-run after the Notebook restarts. -
Run Cell and Advance - Runs code in the selected cell and advances to the next cell.
-
Add New Cell - Adds new input cell above or below the current cell.
-
Add to Report - Adds the output of the selected cell to the Report.
-
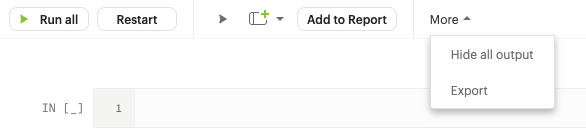
More → Hide All Output - Hide all output in the notebook. Refreshing the Notebook will show the output that was previously hidden.
-
More → Export - Exports all input cells as a .py or .r file.
Cell Toolbar

-
Run Cell and Advance - Runs code in the selected cell and advances to the next cell.
-
Add New Cell - Adds new input cell above or below the current cell.
-
Move Cell Up - Moves the current input or markdown cell up.
-
Move Cell Down - Moves the current cell down.
-
Fold Cell - Folds (hides) the current cell. Folded cells can still run.
-
Freeze Cell - Freezes the current input cell so that no changes are allowed; also prevents this cell from running.
-
Markdown/Code dropdown - Allows you to select the type for the current input cell (as code or markdown).
-
Add to Report - Adds the output of the selected cell to the Report.
-
Delete Cell - Permanently removes cell from the notebook.
Working with cells
There are two types of cells in the Notebook:
Markdown - Markdown cells allow you to add context to your analysis. Markdown cells contains text formatted using Markdown and display their output in-place when it’s run.
Code - Input Python or R code into the IN section of the cell. When this cell runs, any corresponding output (including visualizations) will be shown in the OUT section.
Notes:
-
When you run your Notebook, cells are executed in the order they are displayed, starting from the top cell.
-
To select or change a cell’s type, go to the dropdown menu in the cell toolbar and choose Code or Markdown.
-
To run a cell, select it and press
Shift + Return. Or click Run Cell in the cell or main toolbar. -
The number next to the cell label will increment by one every time code in the cell is successfully run.
-
To see available methods for an object, type the name of the object followed by
.and then presstab.
Notebook status
The status indicator, located in the bottom right corner of the browser window, will notify you if there is an issue with your session. It may prompt you to restart the kernel.
-
Setting up notebook - Displayed when opening up a new Notebook, or after re-starting your session.
-
Ready - Notebook is ready to go.
-
Running - Your code is executing.
-
Loading dataframes - This message may display for larger datasets while dataframe information is loaded into the Notebook.
-
Notebook has encountered an unexpected error - Your session has crashed and will need to be restarted.
-
There was a problem with your session - Your session has terminated, and you need to click Restart to get things working again.
-
Cell is still running. Hang tight! - This can appear when code being run includes long-running, computationally intense functions. The Notebook is still online.
-
Notebook is having trouble, try running again - The Notebook is experiencing problems. Please try running your code again to fix the issue.
Accessing query results
The Notebook has access to the results of every query in your Report.
However, the way you access those results differs depending on the language you’re using.
In each case, all query results are delivered to the Notebook as a custom object called datasets.
datasets contains objects of the following type:
Python: pandas DataFrame
R: Data Frame
In your Notebook code, reference query result sets in the datasets list by query name, position, or token.
For example:
| To return results for: | Python | R |
|---|---|---|
First query added to report |
|
|
Second query added to report |
|
|
Query named 'Active Users' |
|
|
Query with token '6763b688fb54' |
|
|
Notes:
-
The
datasetsobject won’t update in the Notebook until after all queries in the Report have run successfully. -
R is 1-indexed and Python is 0-indexed.
-
If you refer to query results by the query name, remember to update your code if you rename the query in your Report.
-
The order of the results in the
datasetsobject is based on when the query was added to the Report. Renaming a query may change the order it’s displayed in the report editor, but will not affect its position in thedatasetsobject.
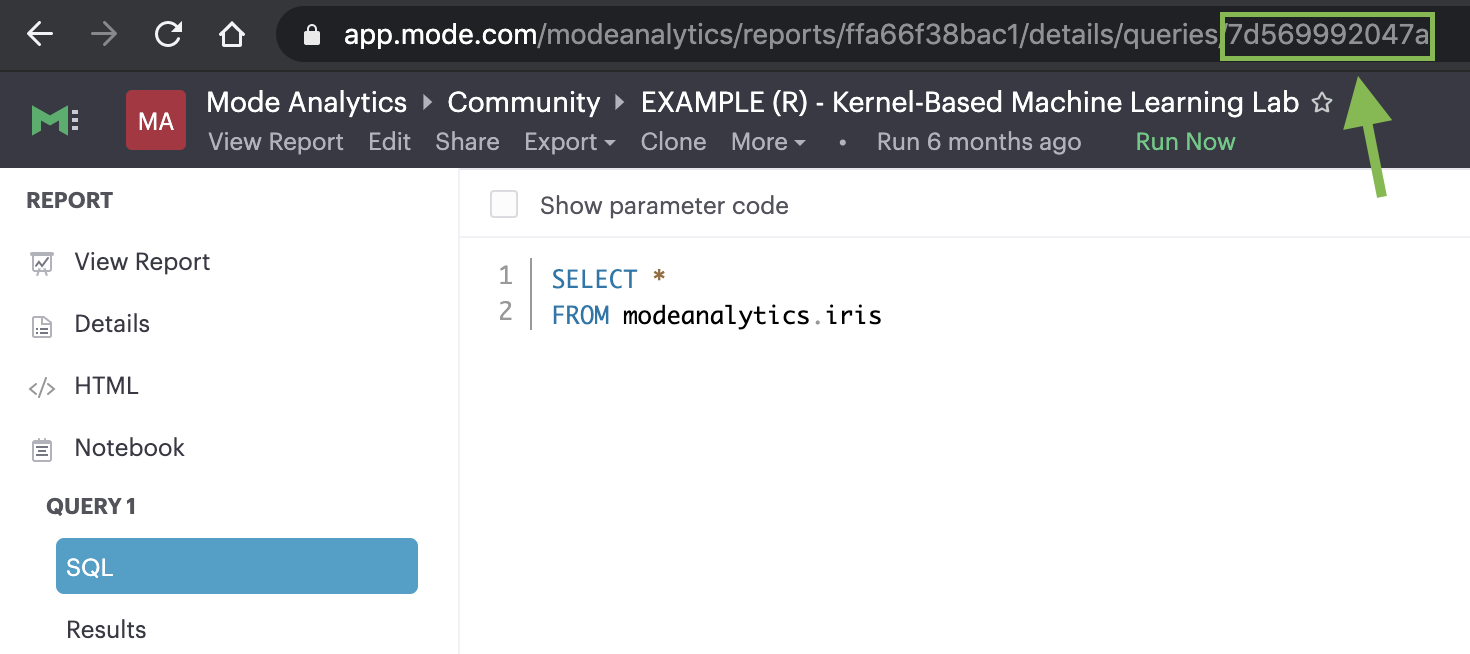
How to find a query’s token
To find the query token starting from the Notebook or editor, click View in the header, then View details, and then click SQL for the query you wish to use. The URL for SQL contains the query token at the end:
https://app.mode.com/ORGANIZATION_USERNAME/reports/REPORT_TOKEN/queries/QUERY_TOKEN
Memory management in Python
Analyst Studio’s Python notebook has 16GB of RAM and up to 16 CPU available to it. The free Analyst Studio Studio notebook is limited to 4GB of RAM and 1 CPU. To effectively manage memory usage in the Analyst Studio Notebooks, consider (1) data load of query result sets, (2) incremental library installation, (3) memory utilization in session.
Data load of query result sets
Query result sets are loaded into the notebook when the user explicitly references the query. Users can consistently load up to 2GB per raw query result as a pandas dataframes in the Notebook.
Incremental library installation
For Analyst Studio Business and Enterprise paid plans, the Notebook environment has up to 1 GB of memory available to load additional packages.
Memory utilization in session
Memory usage in the python Notebook can be checked by running the following command:
from pympler.tracker import SummaryTracker
tracker = SummaryTracker()
tracker.print_diff()
Output
Python Datasets
Python Datasets are tables of data created from tabular output in Notebooks, designed for use within a specific Report. They allow analysts to leverage Analyst Studio’s native visualizations and create calculated fields from dynamic output results, which automatically update whenever the Report or Notebook is rerun.
In addition, Analysts can publish these Python Datasets directly to ThoughtSpot, enabling them to power Liveboards, SpotIQ, and other TS experiences. This makes it easy to operationalize Python-based analyses and seamlessly integrate them into broader decision-making workflows across the organization.
Key benefits
-
Integrated workflow: Leverage data directly from Notebooks without the need for manual file creation or external scripts. Python Datasets can be published to ThoughtSpot, enabling a seamless flow from code to insights across Liveboards, SpotIQ, and other TS features.
-
Visual analysis: Take advantage of native charting in Analyst Studio through Quick Charts and the Visual Explorer, and extend these insights by operationalizing Python outputs into TS-native visualizations for broader consumption.
-
Enhanced data prep: Build a shared understanding of business logic by adding field descriptions and calculated fields to your Python results. These enriched datasets can be published to TS, ensuring consistency and clarity across all downstream analytics.
How it works
-
Generate tabular Output in Your Notebook
Run your analysis or computation in the Notebook to produce the desired tabular output.
Only outputs that are pandas DataFrames can be exported as datasets. Ensure that the last output of the cell is a pandas DataFrame to enable export. If the cell has no output, an empty dataset will be created without any data. -
Create a new Dataset
From the Use output dropdown menu, select the option to Create a dataset.

-
Use the Dataset
Once created, the dataset will appear under the Data section of the Report. You can use it like any other query result or Dataset, and add calculated fields and visualizations to further your analysis.

-
Publish to ThoughtSpot
Similar to SQL Datasets, you can now publish the dataset to Data workspace within ThoughtSpot.

Add CSV export to a cell
You can add an export button to a Notebook output cell so viewers can export the calculated results contained in any dataframe to a CSV. The following examples add an export button to an output cell that will generate a downloadable CSV of the query results of a query named “New Users”:
-
Python
-
R
import notebooksalamode as mode |
# Required library in Python |
df = datasets["New Users"] |
# export_csv() accepts any valid pandas DataFrame. |
mode.export_csv(df) |
# This example uses the result set from a query named "New Users". |
df <- datasets[["New Users"]] |
# export_data() accepts any valid Data Frame. |
export_data(df) |
# This example uses the result set from a query named "New Users". |
Supported libraries
Analyst Studio enables easier access to advanced analytical functions by supporting well-established, public libraries within Analyst Studio’s Notebooks. Common use cases include:
-
Data Manipulation - Cleaning, aggregating, and summarizing data.
-
Statistics - Simple things like distributions, regressions, and trend lines, as well as some advanced tasks like predictive modeling and machine learning.
-
Advanced Visualization - Python and R have many visualization libraries, enabling analysts to quickly build charts including heatmaps, small multiples, and distributions.
Python Cleanslate Environment
The Python Cleanslate environment is a new execution option available alongside Python 3 and Python Edge. It starts without any pre-installed third-party packages, giving users full control over their environment setup. This is ideal for analysts who want a minimal, dependency-free starting point for custom workflows.
Python
Analyst Studio supports Python version 3.11 in the Notebooks.
Each environment comes preloaded with the following libraries:
| Library | Version (Py3) | Version (Edge) | Description |
|---|---|---|---|
1.2.3 |
1.2.3 |
date & time manipulation & formatting |
|
4.12.3 |
4.12.3 |
parsing HTML, JSON & XML data |
|
0.17.3 |
0.17.3 |
bind Plotly directly to pandas dataframes |
|
1.3.0 |
1.3.2 |
convex optimization library |
|
2022.12.0 |
2024.8.0 |
flexible open-source Python library for parallel computing |
|
0.6.0 |
0.6.0 |
in-process database management system focused on analytical query processing |
|
3.1.3 |
3.1.3 |
MIT MCMC library |
|
0.4.0 |
0.4.0 |
defensive data analysis |
|
1.8.22 |
1.8.22 |
read & write geospatial data files |
|
0.18.0 |
0.18.0 |
build Leaflet.js maps |
|
1.0.1 |
1.0.1 |
extends pandas to allow spatial operations on geometric types |
|
1.10.0 |
1.10.0 |
helper library for Google Visualization API |
|
0.8.40 |
0.8.40 |
clustering with minimal parameter tuning |
|
0.10.2 |
0.10.2 |
network analysis tools |
|
0.3.0 |
0.3.0 |
fit interpretable ML modes. Explain blackbox ML |
|
1.0.1 |
1.0.1 |
JSON element extraction |
|
0.5 |
0.5 |
converts from CSV to JSON |
|
3.7.0 |
3.7.0 |
neural networks API run on TensorFlow or Theano |
|
0.30.0 |
0.30.0 |
survival analysis |
|
0.11.3 |
0.11.3 |
user behavior analysis |
|
0.18.1 |
0.18.1 |
client for Mapbox web services |
|
3.9.3 |
3.9.3 |
2D plotting visualizations |
|
3.2.1 |
3.2.1 |
complex network manipulation |
|
3.9.1 |
3.9.1 |
natural language toolkit |
|
2.8.4 |
2.8.4 |
fast numerical array expression evaluator |
|
2.0.1 |
2.0.1 |
various scientific computing functions |
|
2.2.3 |
2.2.3 |
data structures & data analysis tools |
|
3.5.0 |
3.5.0 |
generates profile reports from a pandas DataFrame |
|
0.7.3 |
0.7.3 |
query pandas dataframes using SQL syntax |
|
0.5.3 |
0.5.3 |
describing statistical models/building design matrices |
|
21.2.5 |
- |
package installer |
|
5.24.1 |
5.24.1 |
data visualizations, dashboards & collaborative analysis |
|
1.0.0 |
1.0.0 |
geographic shape files to support plotly map functionality |
|
3.12.0 |
3.12.0 |
display tabular data in ASCII table format |
|
1.1.6 |
1.1.6 |
forecasting with time series data |
|
3.0.0 |
3.0.0 |
create interactive svg charts |
|
1.10 |
1.10 |
interface for Graphviz graph layout & visualizations |
|
2.0.5 |
2.0.5 |
access Google spreadsheets through the Google Sheets API |
|
1.0.1 |
1.0.1 |
measure, monitor and analyze the memory behavior of Python objects |
|
3.4.0 |
3.4.0 |
cartographic transformations & geodetic computations |
|
2.7.0 |
2.7.0 |
geospatial analysis library |
|
2.2 |
- |
query zip codes & location data |
|
2.2 |
2.2 |
query zip codes & location data |
|
2.28.1 |
2.28.1 |
make HTTP requests |
|
0.24.0 |
0.24.0 |
image processing |
|
1.5.2 |
1.5.2 |
tools for data mining & analysis |
|
1.1.0 |
1.1.0 |
bootstrap confidence interval algorithms for scipy |
|
1.13.1 |
1.13.1 |
advanced math, science & engineering functions |
|
2.7.1 |
2.7.1 |
scraping web pages |
|
0.13.2 |
0.13.2 |
statistical graphics visualizations |
|
1.8.5.post1 |
1.8.5.post1 |
manipulation & analysis of geometric objects |
|
1.16.0 |
1.16.0 |
Python 2 & 3 compatibility library |
|
3.4.3 |
3.4.3 |
advanced natural language processing, including all small pipelines |
|
0.4.3 |
0.4.3 |
implementation of the squarify treemap layout algorithm |
|
0.14.4 |
0.14.4 |
estimate statistical models & perform statistical tests |
|
1.13.3 |
1.13.3 |
symbolic mathematics |
|
0.9.0 |
0.9.0 |
pretty-print tabular data |
|
2.18.0 |
2.18.0 |
numerical computation using data flow graphs |
|
1.1.0 |
1.1.0 |
train, run and interpret decision forest models in tensorflow |
|
0.18.0.post0 |
0.18.0.post0 |
common natural language processing tasks |
|
1.0.0 |
1.0.0 |
fast & reliable user agent parser |
|
1.26.13 |
1.26.13 |
HTTP client for python |
|
1.9.4 |
1.9.4 |
wordcloud generator |
|
2.1.3 |
2.1.3 |
optimized distributed gradient boosting library |
We strongly discourage using either the requests or pygsheets libraries to access APIs that require authentication using personally identifiable credentials and information, as they will be visible to viewers of your Report.
|
Edge
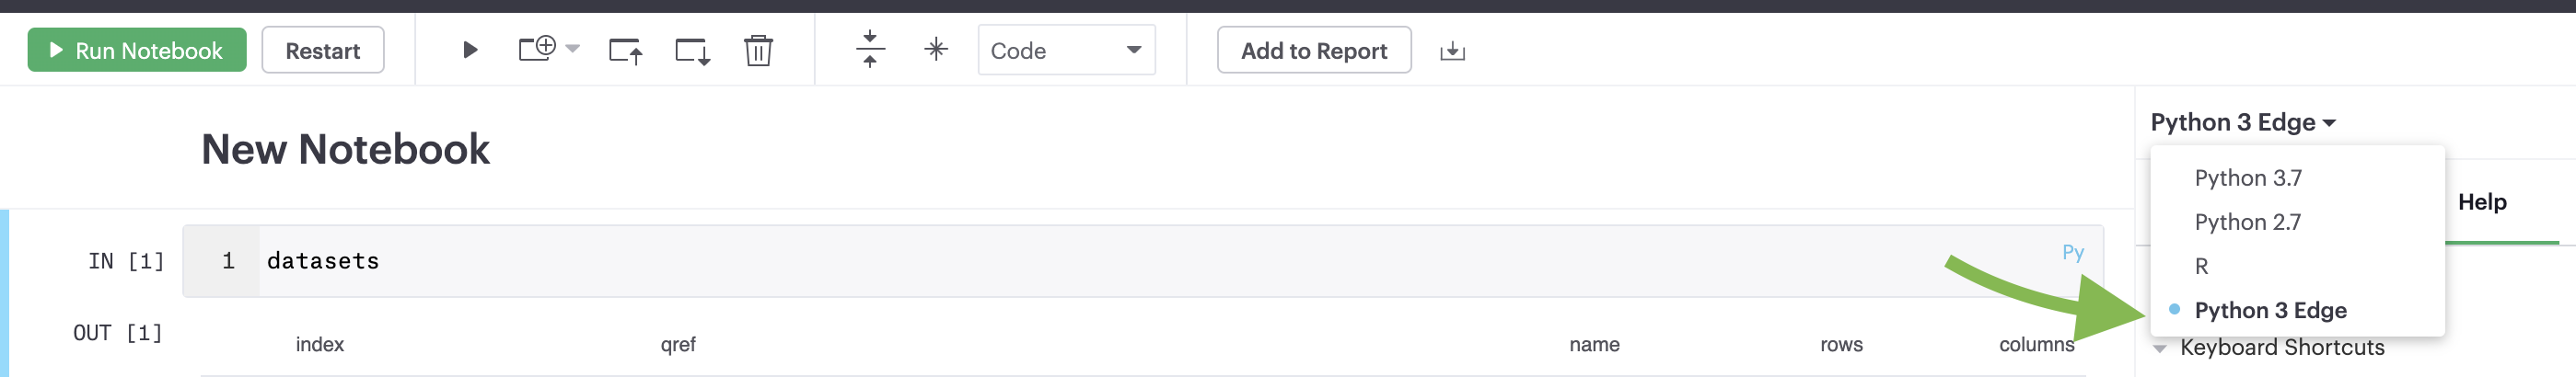
Analyst Studio provides access to an additional Python 3 environment called Python 3 Edge where pending library upgrades are staged. Analysts should use Edge as an alternative environment where they can test out the updated versions of supported Python libraries without fear of jeopardizing scheduled Reports.
Analyst Studio will announce periodic scheduled promotion events via emails to Analyst Studio account administrators. Users will have at least 30 days from that time for testing and validation before the library updates will be made in the broader Python 3 environment. Any Notebooks using the Edge environment will be migrated to use the Python 3 environment at the same time.
Analysts can access Edge via the environment dropdown in the upper right-hand corner of the Notebook. When switching between environments, remember to Restart the Notebook session.
R
The Notebook supports R version 4.2.0 and comes preloaded with the following R packages:
| Library | Version | Description |
|---|---|---|
2.4.3 |
buy-til-you-die (BTYD) models |
|
1.2.0 |
extends BTYD |
|
1.2.7 |
estimates causal effect of intervention on time series |
|
2.1.2 |
extension to ggplot2 |
|
7.3-58.1 |
functions & datasets to support Venables & Ripley |
|
1.1-3 |
ColorBrewer palettes |
|
0.2.1 |
easy pre- and post-assertions |
|
1.2.3 |
S3 class to represent BLOBs |
|
6.0-93 |
streamlines creation of predictive models |
|
2.1.4 |
cluster analysis extended Rousseeuw et al. |
|
2.0-3 |
color space manipulation |
|
1.14.2 |
extends data.frame |
|
1.0.9 |
Build graph/network structures |
|
2.0-0.1 |
color schemes for dichromats |
|
0.6.29 |
create compact hash digests of R objects |
|
1.0.10 |
a grammar of data manipulation |
|
0.5.2 |
working with categorical variables (factors) |
|
8.17.0 |
forecasting for time series & linear models |
|
0.4.0 |
Datasets referenced in book "Forecasting: principles and practice" |
|
0.1.23 |
dendrograms & tree plots with ggplot2 |
|
3.3.6 |
system for creating graphics |
|
0.4.0 |
publication-ready ggplot2 plots |
|
0.5.3 |
ridgeline plots in ggplot2 |
|
4.2.4 |
extra themes, scales, & geoms for ggplot2 |
|
1.6.2 |
glue strings to data |
|
0.3.1 |
arrange grobs in tables |
|
6.0.2 |
hierarchical & grouped time series |
|
1.4.4 |
tools for working with URLs & HTTP* |
|
1.0.14 |
provides iterator construct |
|
0.1-3 |
various tools for creating iterators |
|
2.1.0 |
various tools for creating iterators |
|
0.9-31 |
kernel-based machine learning lab |
|
1.3.1 |
weighted k-nearest neighbors |
|
1.3 |
least angle regression, lasso & forward stagewise |
|
0.20-45 |
trellis graphics |
|
0.2.2 |
lazy (non-standard) evaluation |
|
2.1.1 |
Create interactive Web Maps |
|
1.8.0 |
date and time manipulation |
|
2.0.3 |
a forward-pipe operator |
|
0.1.9 |
modelling functions that work with the pipe |
|
0.5.0 |
utilities for using Munsell colors |
|
7.3.17 |
feed-forward neural networks & multinomial log-linear models |
|
4.10.0 |
data visualization, dashboards & collaborative analysis |
|
1.0 |
automatic forecasting procedure |
|
1.0.0 |
prototype object-based programming |
|
0.3.4 |
tools for working with functional vectors |
|
1.4.4 |
transform data between wide & long |
|
1.0.5 |
functions for base types & core R & tidyverse features |
|
1.2.1 |
scale functions for visualizations |
|
1.4.1 |
work with character strings & reg ex |
|
1.2.1 |
easily create tidy data |
|
0.3.4 |
conversion of text to and from tidy formats |
|
0.7-8 |
text mining |
|
1.2.2 |
fixes bugs in R’s UTF-8 handling |
|
0.4.1 |
port of matplotlib color maps |
|
1.3.3 |
parse XML |
|
1.8-11 |
S3 infrastructure for regular & irregular time series |
We strongly discourage using the httr library to access APIs that require authentication using personally identifiable credentials and information, as they will be visible to viewers of your Report.
|
Install additional libraries
To use a publicly available library in the Notebook, users can leverage each environment’s package manager to install that library at run-time. The Notebook environment has up to 1 GB of memory available to load additional packages.
| Analyst Studio’s Notebook architecture limits access between manually installed libraries and the Notebook’s kernel. As a result, certain popular interactive libraries like Plotly, Bokeh, and ipywidgets may behave differently compared to how they are advertised. |
Python
Installing libraries
To install a library for use within a notebook, add the following command in any cell:
! pip install library_nameReplace library_name with the name of the desired Python package. This command will install the library within the scope of the active Notebook, making it immediately available in subsequent cells. Note that each library installed this way is specific to the Notebook, so re-installation may be required for each session or upon reattachment.
Installing specific versions
You can specify a version by including it in the command, for example:
! pip install library_name==version_numberThis can be helpful to ensure compatibility or access to specific features within a version.
Using installed libraries
Next, in a subsequent cell, use below statement for each library that you want to include in your environment:
from library_name import librarynameHandling dependencies
Analyst Studio Notebooks support dependencies for many commonly used packages; however, some packages with highly specialized dependencies may not be fully compatible. In these cases, consider using well-supported library alternatives when possible.
Viewing and managing installed libraries
To see a list of all libraries installed in your notebook session, use:
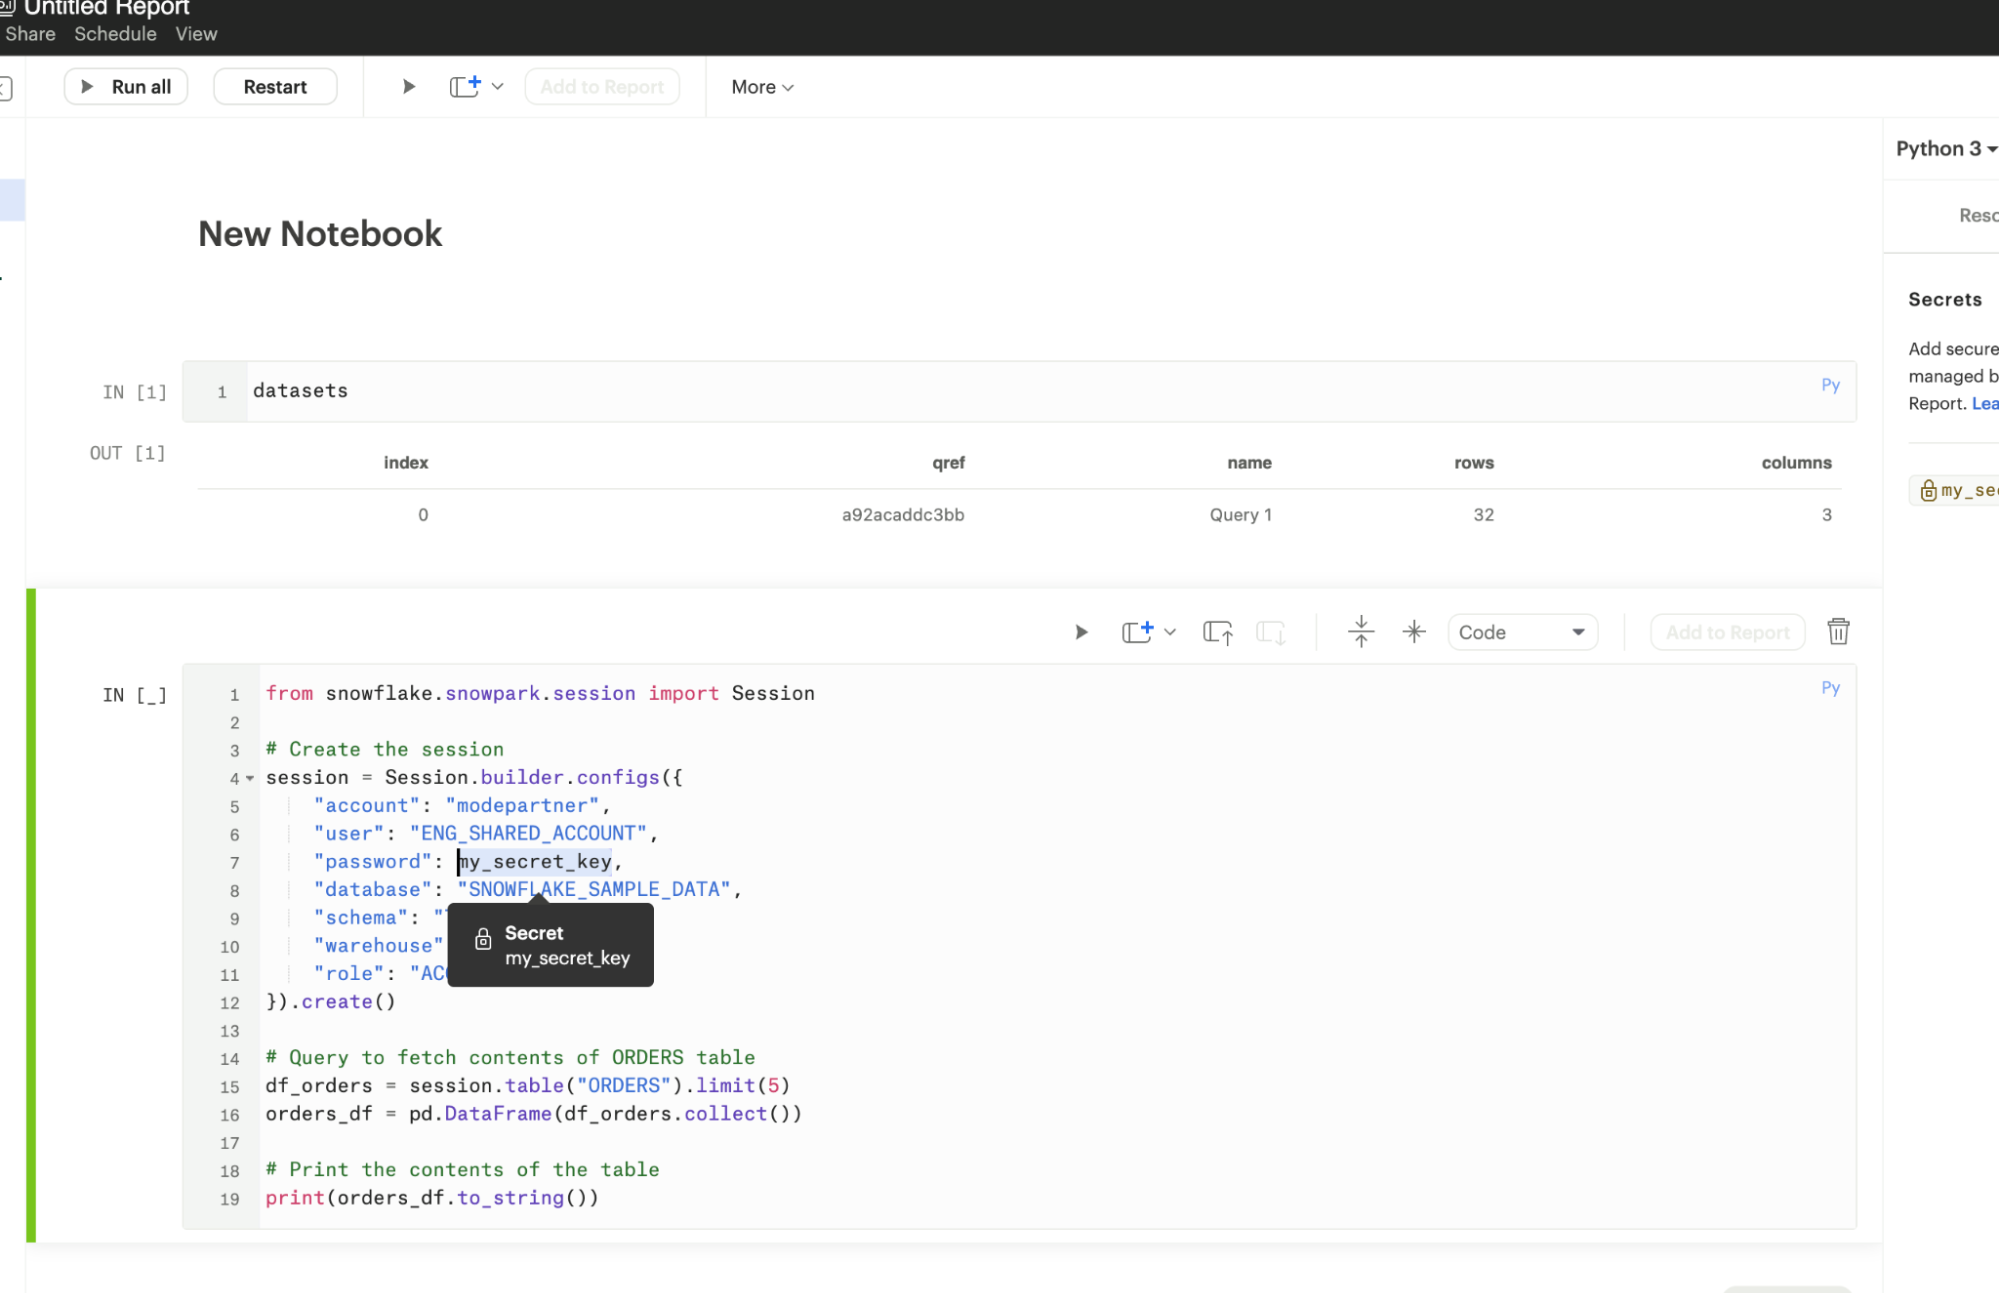
%pip listAccessing APIs securely with Secrets Store
For libraries requiring API keys or other sensitive credentials, Analyst Studio now offers a Secret Store feature that allows you to securely manage these details. By storing your credentials in the Secrets Store, you can safely use them within your notebooks without hardcoding sensitive information.
To retrieve a stored secret in your notebook, use the following:
from library_name import libraryname

session = Session.builder.configs({
    "account": "demoaccount",
    "user": "DEMO_SHARED_ACCOUNT",
    "password": protected_password,
    "database": "SOURCE_SAMPLE_DATA",
    "schema": "TCCP_DB1",
    "warehouse": "DEMO_WH",
    "role": "ACCOUNTADMIN"
}).create()
With the Secrets Store, you can access APIs securely, making it easier to integrate external data sources without exposing authentication information.
R
First, use below syntax into a Notebook cell for each public package that you want to install into the R Notebook.
install.packages (“library_name”)Replace library_name with the name of the desired R package.
Next, use below syntax for each library you want to include in your environment from the installed package(s). For example:
library (“library_name”)You may now use any of the methods or functionality included in the library in subsequent Notebook cells.
Notebook keyboard shortcuts
General
| Action | Mac | PC |
|---|---|---|
Edit selected cell |
|
|
Run cell |
|
|
Select cell above |
|
|
Select cell below |
|
|
Insert cell above |
|
|
Insert cell below |
|
|
Move cell above |
|
|
Move cell below |
|
|
Python Notebooks secrets store
Overview
The secrets store provides users with an intuitive and secure way to protect their credentials used in the Notebook. This helps users to extend their analysis by pulling in the data and libraries they need outside of SQL queries against their data warehouse. These credentials are stored encrypted and obfuscated to all users.
| Secret store is currently only available for Python Notebooks. |
Managing secrets
-
Users can add secrets at a Report level and the secret only applies to that Report.
-
All Editors of that Report can use, edit, and delete existing secrets. They can also add new secrets to the Report.
-
Once secret values are added, they will always be obfuscated. Editing a secret would mean replacing the old secret with a new one. There is no way to print a secret value after it is added.
-
Users cannot use a secret from a Notebook in another Report, even if duplicating a Report with an existing secret.
Using the secret store
-
In the Python Notebook, click New Secret on the right side panel, under the Secrets tab and add the Display name and Secret value.
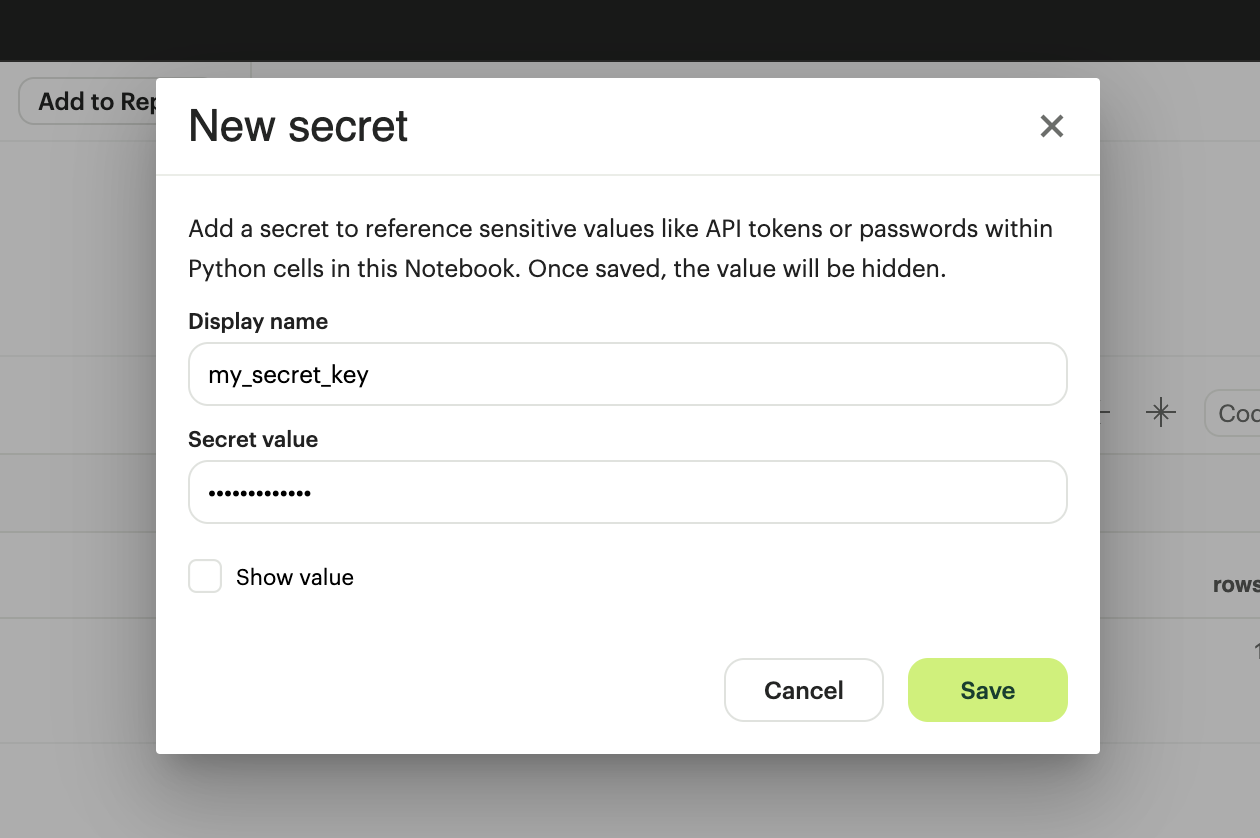
Secrets will need to meet the following criteria:
-
The secret display name must be within 1-100 characters long.
-
The secret display name can only contain alphanumeric characters and underscores, and must begin with a letter.
-
The secret values must be within 1-4096 characters long.
-
-
Once saved, users can use the Display Name as a variable in the Python cells.
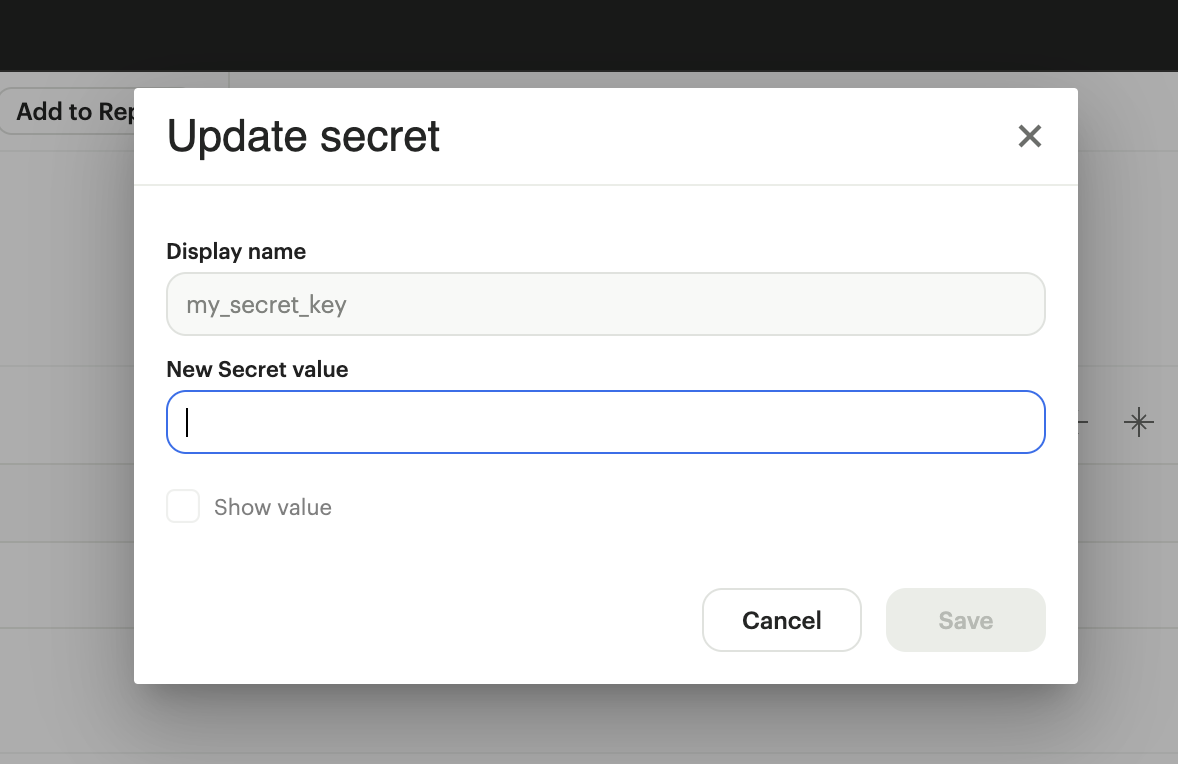
Editing secrets
Once secret values are added, they will always be obfuscated. Editing a secret would mean replacing the old secret with a new one.
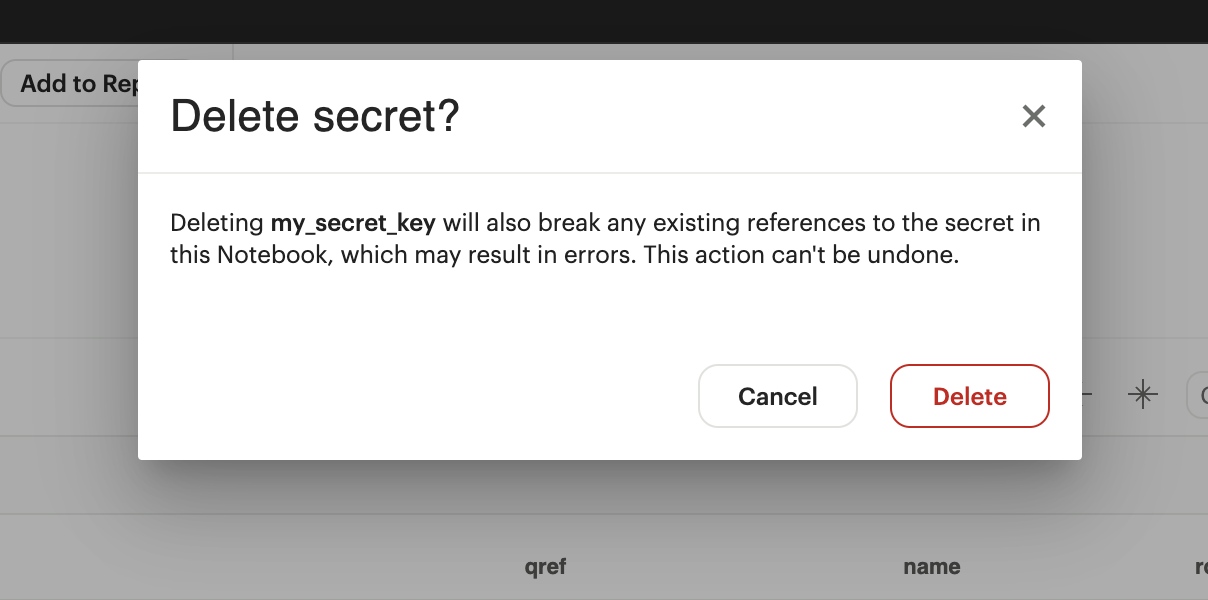
Deleting secrets
Deleting a secret will also break any existing references to the secret in the Notebook. Any editor of the Report can delete a secret and the action can’t be undone.
Administrative features
-
Admins can use Discovery Database (DDB) to get a list of all Reports using secrets.
-
Changes made to secrets are audited, and customers should reach out to ThoughtSpot support to obtain that information.
FAQs
Q: Can you visualize a Notebook-generated visualization with Analyst Studio’s native chart editor?
At this time, it is not possible to use our visualization tools, such as Quick Charts and Visual Explorer, to manipulate Python/R dataframes. To visualize data from a Notebook, you will need to use a visualization library to create a visualization. If you would like to see this functionality added in the future, please contact ThoughtSpot support, and they will be happy to add a request on your behalf for future consideration.
Q: How to pass parameters into the Notebook?
To pass parameters to your Notebook, you must add them as a column in your SQL query. You can then access those column(s) in the dataset object in your Notebook:
SELECT
 '{{team}}' AS param
FROM
 benn.nfl_touchdowns
Q: Can I use dbt Metrics in Notebooks?
Yes. Since metrics charts are SQL Queries under the hood, their results are made available to the Notebook and appear as data frames alongside all other Query results in a given Report.
Q: When do queries in the Notebook start to execute after a report run?
SQL Queries are kicked off simultaneously, and their results come in based on the processing time of your database. The Notebook will wait until all SQL queries have successfully returned results before running. This is because the logic is set up such that the Notebook does not know which query results execution is dependent on, so to be safe, it waits for all the SQL queries to finish running.
Therefore, it is possible that the Notebook would render faster, but it must wait for all queries to finish running.
Q: Do you have a tutorial where I can learn Python for business analysis using real-world data?
We do have a tutorial available that teaches Python for business analysis using real-world data. This tutorial is designed for users with little or no experience with Python, and it covers everything from the basics of the language to advanced techniques for analyzing and visualizing data.
If you’re interested in learning how to use Python for business analysis, this tutorial is a great place to start. It includes step-by-step instructions and hands-on exercises to help you apply what you learn to real-world scenarios.


