Null and missing values in charts
You can now choose how null and missing date values appear in line, line column, line stacked column, column, and bar charts in ThoughtSpot. From the Chart configuration menu ![]() for the date column, you can decide to show or hide null values in column, line, and bar charts. You can also decide how to display missing date values from the Chart configuration menu for each measure column.
for the date column, you can decide to show or hide null values in column, line, and bar charts. You can also decide how to display missing date values from the Chart configuration menu for each measure column.
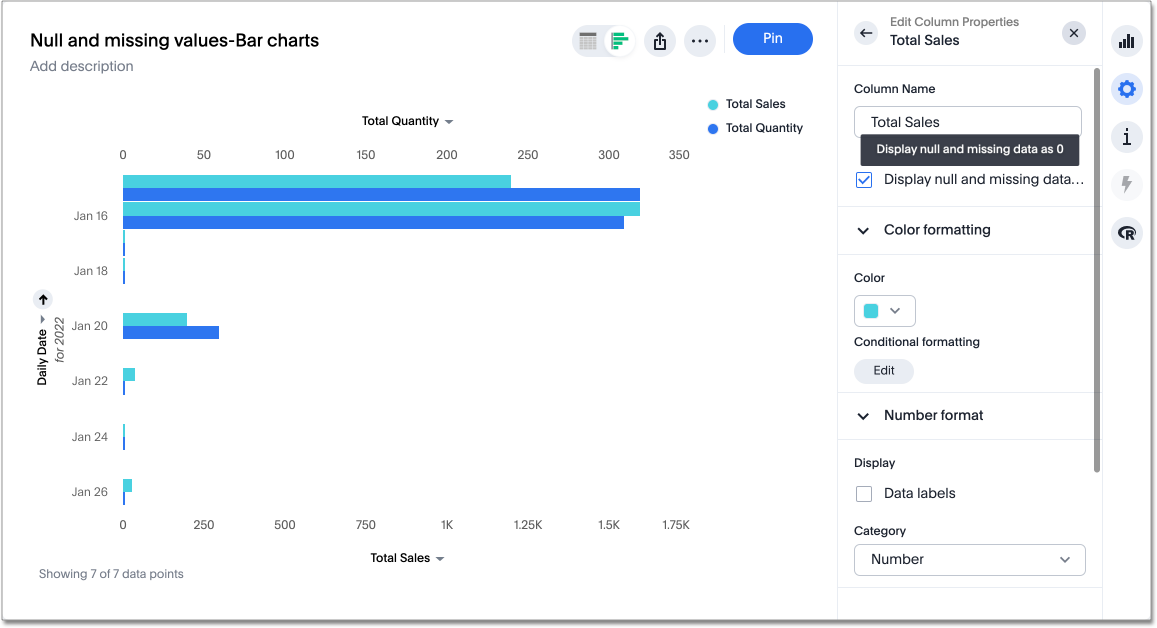
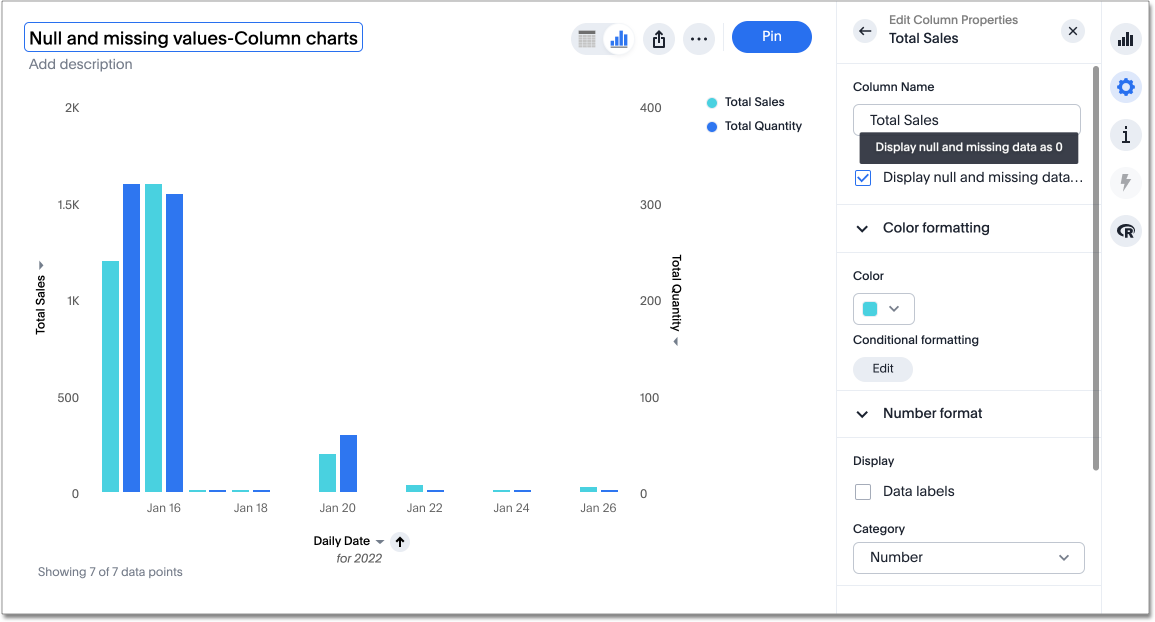
Previously, ThoughtSpot displayed null, missing, and zero values as empty spaces on bar and column charts. To make it easier to identify null and zero values, you can now choose to display null and zero values as bars of 1 pixel width on bar and column charts. Missing values appear as blank spaces.
| This feature is only available for line, line column, line stacked column, column, stacked column, bar, or stacked bar charts. |
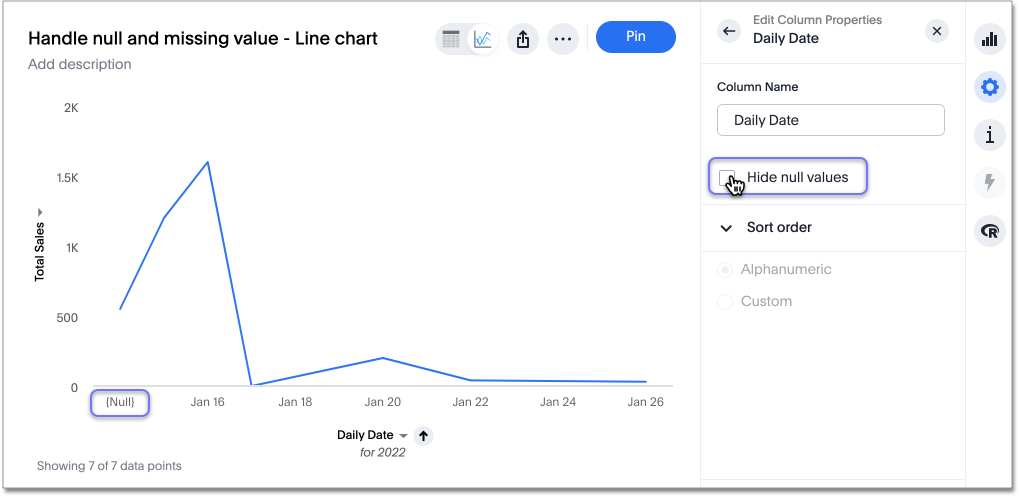
Show or hide null values
To choose to show or hide null values, follow these steps:
-
Choose your measure and attribute values for your Answer. You must include a Date value to access the option on whether to display null values. Click the Change visualization icon
 to select the chart type as Line, Line Column, Line Stacked Column, Column, Stacked Column, Bar, or Stacked Bar. You must include at least one attribute and one measure column.
 -
Click on the Chart configuration menu icon
 and select the Date measure column.
 -
Select the Hide null values checkbox to hide null values. Deselect this option to show null values.
Choose how to display missing values for line charts
You can choose whether to display missing date values as zero values, line breaks, or an average of proximate values on a line, line column, or line stacked column chart. Rather than showing a sharp decline to zero every time there is null or missing data on your line chart, you can see the missing values represented as line breaks or interpolations of the closest values instead.
To choose how to display missing date values in line, line column, or line stacked column charts, follow these steps:
-
Choose your measure and attribute values for your Answer. You must include a Date value to access the option on how to display missing values. Click the Change visualization icon
to select the chart type as Line, Line Column, or Line Stacked Column. You must include at least one attribute and one measure column. -
Click on the Chart configuration menu icon
and select your attribute column (for example, Sales). -
Under Line display format for missing dates, select one of the following options:
-
Ignore missing dates. Your chart will display missing dates as an average of the proximate values.
-
Show gaps for missing dates. Your chart will remove sections of the line chart where there are no date values.
-
Treat data for missing dates as 0. Your chart will display zero values for the missing dates.
-
Choose how to display missing values for bar and column charts
To choose how to display missing date values in bar, stacked bar, column, and stacked column charts, follow these steps:
-
Choose your measure and attribute values for your Answer. You must include a Date value to access the option on how to display missing values. Click the Change visualization icon
to select the chart type as Bar, Stacked Bar, Column, or Stacked Column. You must include at least one attribute and one measure column. -
Click on the Chart configuration menu icon
and select your attribute column (for example, Sales). -
Select the Display null and missing data as 0 checkbox. Your chart will display null and missing data as a bar or column with zero value.