Semi-additive measures with first_value and last_value functions

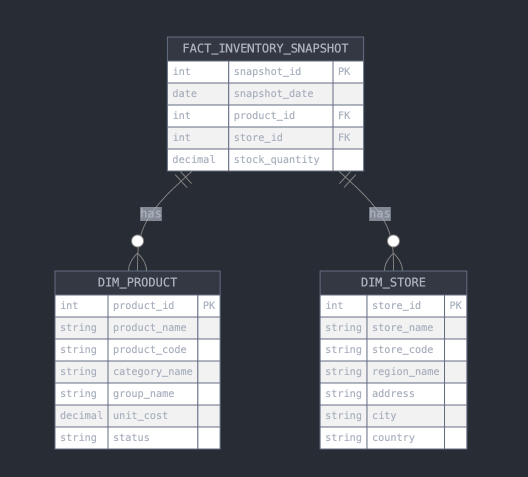
A semi-additive measure, also known as snapshot data, is a measure that is usually aggregated for all attributes except for date and time. For certain measures, like inventory, you want to know what the value was at the beginning or end of a period. In that case, you can use the last_value function to find the inventory at the end of a month, rather than aggregating all values over the month. Similarly, you can use the first_value function to find out your stock at the beginning of a month.

The last_value and first_value functions leverage the equivalent SQL functions to return the last or first value for the defined data partition. This is not necessarily the last date of the date partition, but rather the last date for which there is a data entry. Note that if the underlying database does not support the last value or first value SQL functions, you cannot use these functions in ThoughtSpot.

The first_value and last_value functions return the first or last value of the defined partition. The partition is defined with the query_groups() setting. This does not necessarily correspond to the first or last value of a date bucket. For example, the value returned may not be the last day of the month (but rather the last day in the month that had a value). The reason for this is NULL (or no records) is not the same as a record of zero value.

Formula syntax

The basic syntax of the last_value function is: last_value(operation(measure or attribute),query_groups(),{column to order by}). For example: last_value(sum(balance),query_groups(),{transaction date}).

The first argument, "sum(balance)" identifies the aggregate type and the measure column. The second argument, "query_groups", partitions the data by column list; Use query_groups so that all columns in the search bar are included. The final argument, "{transaction date}", orders the results by that column.

Note that last_value and first_value functions support the query_groups() + () and query groups() - () arguments like group aggregate functions do. You can enter multiple columns in the third argument.

You can include an outer aggregate function wrapping around the last_value function. If you don’t supply an outer aggregate, the aggregation defaults to SUM for numeric columns and MAX for non-numeric columns. You can use simple aggregates like sum, min, max, average, or advanced aggregates like group_average, moving_sum, and cumulative_sum.

If you do not specify an outer aggregate function in your formula, you can also add it from the search bar by entering "max", "min", "sum", etc.

Consider the following example formulas:

  • Balance with Implicit Aggregate = last_value(sum(balance),query_groups(),{transaction date})
    This formula is used to return the balance of inventory. There is no outer aggregation specified, so it defaults to sum. You can change the outer aggregation by entering the aggregation type in the search bar.

  • Balance with Explicit Aggregate = sum(last_value(sum(balance),query_groups(),{transaction date}))
    This formula is used to return the balance of inventory. The outer aggregation is specified as sum. You cannot change the outer aggregation by entering a new aggregation type in the search bar.

  • Last date of partition = max(last_value(max(transaction date), query_groups(), {transaction date})
    This formula is used to determine the last date an event occurred within a partition. It calculates the maximum transaction for the partition of query groups, or columns, that are referenced in the query.

  • 3 Month Average Balance = moving_average(last_value(sum(balance),query_groups(),{transaction date}), 3,-1, transaction date)
    This formula is used to find a moving average of the last three months before the current month.

  • 3 Month Average Balance Advanced = group_aggregate(moving_average(last_value(sum(balance),query_groups(),{transaction date}), 3,-1, transaction date), query_groups(), query_filters()-{transaction date})
    This formula is used to find a moving average of the last three months before the current month. It wraps the outer aggregation in another function so that you can add filters from the query, such as this year, and ensure the results are correct.

  • Regional Balance = group_aggregate(sum(last_value(sum(balance),query_groups(),{transaction date})),{Region}, query_filters())
    This formula uses the group_aggregate function to calculate a level of detail expression, such as calculating the value of the balance at the regional level.

Last_value example use case

For the following examples, consider a schema where the Stock Balances fact table is connected to the Date dimension table on the date column, and connected to the Product dimension table on the sku column.

Table 1. Stock Balances Fact
date sku balance

1st Jan

ctr1

0

1st Jan

frb1

0

2nd Jan

ctr1

5

2nd Jan

frb1

10

7th Jan

ctr1

0

7th Jan

frb1

6

31st Jan

ctr1

8

31st Jan

frb1

4

28th Feb

ctr1

6

28th Feb

frb1

6

22nd Mar

ctr1

8

31st Mar

frb1

4

30th Dec

ctr1

3

30th Dec

frb1

10

Table 2. Date Dimension
date

1st Jan

2nd Jan

7th Jan

31st Jan

28th Feb

22nd Mar

31st Mar

…​

31st Dec

Table 3. Product Dimension
sku product category group

ctr1

red t-shirt

t-shirts

clothing

frb1

blue runners

running

footwear

Note that for the Stock Balances fact table, the grain is date and product. For each date, there is a row that defines what the balance for the product is at the sku level. The final transaction date is December 30th.

This is a semi-additive fact table; we can add up the balances for the product column, but we can’t add them up over all dates. The true balance for a select date is the balance recorded that day, it is not the sum of balances for the dates leading up to it.

To calculate the last value of the stock balance for a date, create the stock balance formula and add it to your search:

stock balance = last_value(sum(balance),query_groups(),{date})

The formula returns a sum of all the balance values for the last date in the dataset. Here, the date column comes from the date dimension table. The final date in the date dimension table is December 31st, but the last date for which there is a balance value is December 30th. The formula returns the balance for December 30th: 13.

If you search for stock balance yearly, the formula sums the balance values for the last date in each year. If your dataset contained multiple years, it would sum the balance for each year. Since this dataset contains only one year, the formula returns the balance for December 30th: 13.

If you search for stock balance group january, the formula sums the balance for the last date in the dataset, filtered for January, and separated by group. The formula returns the following table:

date balance group

31st Jan

8

footwear

31st Jan

4

footwear

If you search for stock balance weekly january group, the formula shows the sum of all balance values for the last week for each group, filtered by january, and separated by group:

date balance group

7th Jan

0

clothing

7th Jan

6

footwear

31st Jan

8

clothing

31st Jan

4

footwear

Note that null or missing transaction data entries are not the same as zero-value data entries. If the balance shows as 0, a balancing transaction took place. Missing or null entries do not show as results for last_value or first_value functions. If you prefer to zero out the balance for a period, you must enter the data as a zero in the underlying data set for the final date of the period. In this case, you would enter the following data in the Stock Balances fact table:

date sku balance

31st Dec

ctr1

0

31st Dec

frb1

0

Note that groups with separate last values can affect your results. If you search for stock balance monthly, ThoughtSpot returns the sum of all the balance values for the last date in each month. In this case, you get the following table:

date balance

January

12

February

12

March

4

December

13

Note that the balance for March is the balance for the last date in the data set, March 31st.

If you instead search for stock balance monthly group, ThoughtSpot returns a sum of all the balances for the last date in each month for each group. For March, this includes the values from March 31st and March 22nd, since the formula sums the individual values for each column. You get the following table:

date balance

January

12

February

12

March

12

December

13

Limitations

  • Semi-additive functions cannot span multiple fact tables.

  • Semi-additive functions cannot contain only constant expressions. For example, if you create a formula with no references to a column, such as last_value(sum(1), {}, {true}), ThoughtSpot will not support the function.

  • You cannot combine different partitioning and ordering clauses in different semi-additive functions from the same table, in the same query. That is, a case where formula 1 partitions on Date and Product, and formula 2 partitions on Date, Product, and Client.

  • Average, Variance, Standard Deviation and Unique Count do not work with semi-additive functions across an attribution query. That is, multiple fact tables with at least one non-shared attribute.

  • We do not support semi-additive functions and unique count functions from the same table. Note that a work-around exists by wrapping the unique count in a group_aggregate function. For example, group_aggregate(unique_count(product),query_groups()+{},query_filters()).

  • Advanced aggregates (group, cumulative, moving and rank) cannot be used within the definition of semi-additive functions. Note they can be used to wrap these functions as outer aggregation.

  • ThoughtSpot will support first_value and last_value functions for Redshift and Google BigQuery beginning in the 10.1.0.cl release.

ThoughtSpot University

For more information, view the Introduction to Semi-additive Measures course on ThoughtSpot U.


Was this page helpful?