Time-series forecasting
You can now use SpotIQ analysis to forecast future trends for your KPIs. ThoughtSpot uses machine learning models that learn from past trends, growth, and seasonality to project how the target metric will trend in the future. Note that you can only use forecasting on KPIs that include a time keyword.
Use forecasting
Forecasting on a Liveboard
To use forecasting on a Liveboard KPI, follow these steps:
-
Navigate to the Liveboard containing the KPI you want to forecast future trends for.
-
Hover over the KPI and click the
 More menu icon. Select SpotIQ analyze.
 -
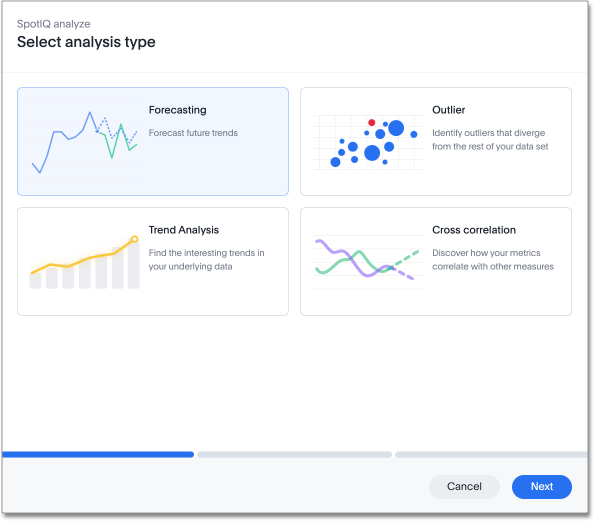
The SpotIQ Analyze Select analysis type window appears. Forecasting is selected by default. Click Next.
-
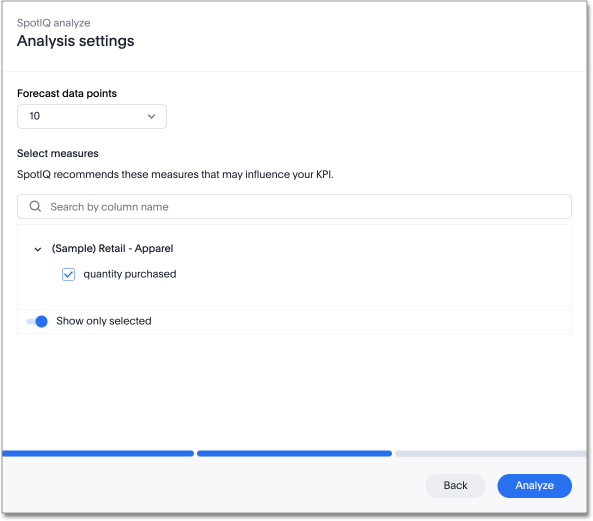
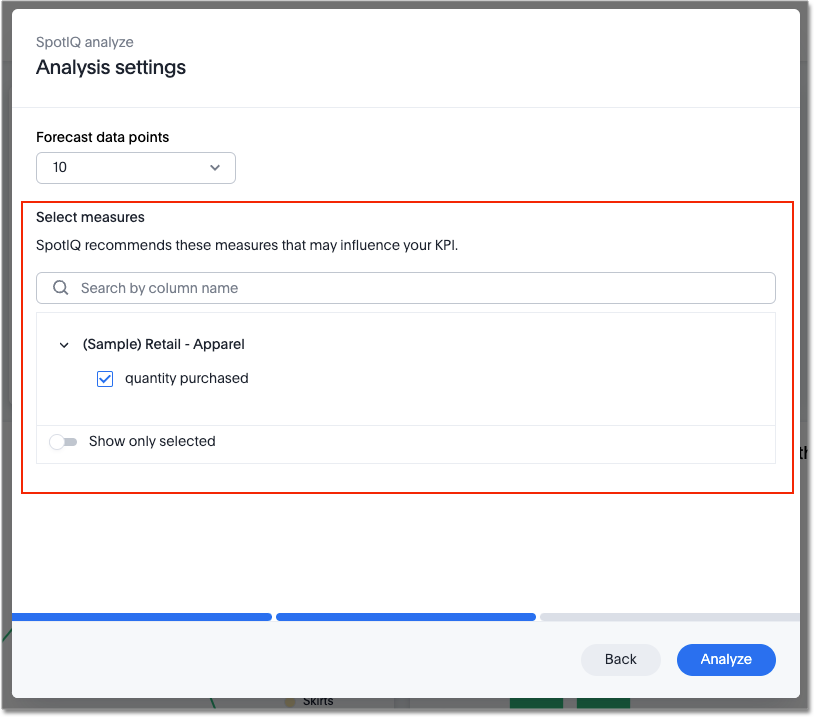
Under Forecast data points, choose whether to calculate 5, 10, 15, or 20 data points for your KPI. By default, 10 is selected.
Under Select measures, choose measures that may influence the movement of your KPI to improve the accuracy of the forecast.
-
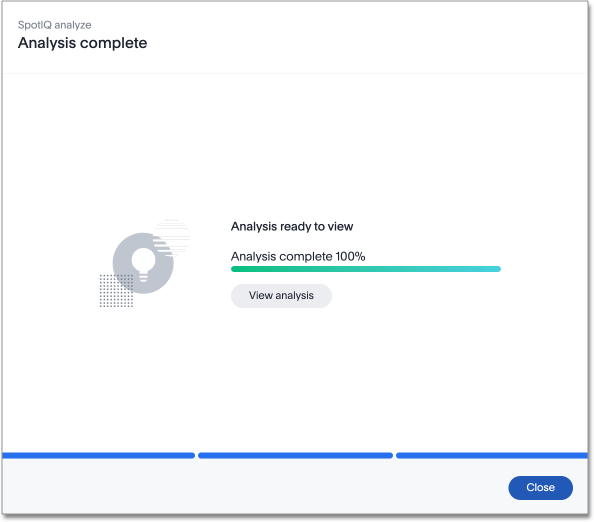
Click Analyze. The Analysis in progress window appears.
-
Once the Analysis in progress bar reaches 100%, click View analysis to see the forecast values.
-
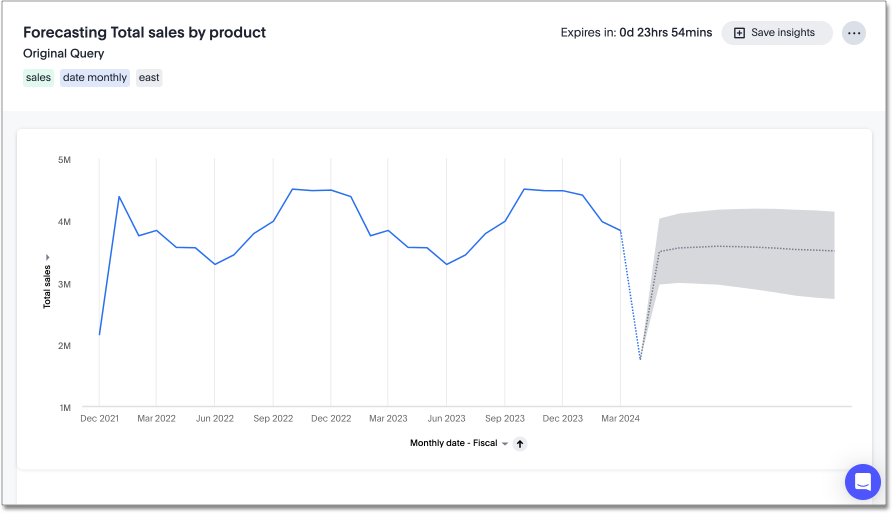
The KPI forecast appears, with a line of predicted values by date and a gray range demonstrating the range of expected values. Note the Expires in value in the top right corner to see when the forecasted insight expires.
-
To save the forecast visualization, select Save insights. You can also click the
More menu icon to share the forecast with other users or groups, or to delete the forecast.
Forecasting on an Answer
To use forecasting on an Answer KPI, follow these steps:
-
Navigate to the KPI you want to use forecasting on.
-
Click the
More menu icon. Select SpotIQ analyze. -
The SpotIQ Analyze Select analysis type window appears. Forecasting is selected by default. Click Next.
-
Under Forecast data points, choose whether to calculate 5, 10, 15, or 20 data points for your KPI. By default, 10 is selected.
Under Select measures, choose measures that may influence the movement of your KPI to improve the accuracy of the forecast.
-
Click Analyze. The Analysis in progress window appears.
-
Once the Analysis in progress bar reaches 100%, click View analysis to see the forecast values.
-
The KPI forecast appears, with a line of predicted values by date and a gray range demonstrating the range of expected values. Note the Expires in value in the top right corner to see when the forecasted insight expires.
-
To save the forecast visualization, select Save insights. You can also click the
More menu icon to share the forecast with other users or groups, or to delete the forecast.
Technical details
Our system leverages a cutting-edge supervised learning technique, using a custom Neural Network architecture with Long Short-Term Memory (LSTM) cells, designed to accurately predict future trends by learning from past and related data. The LSTM cells enable our model to capture both immediate changes and long-term patterns, ensuring our forecasts are both reliable and insightful.
For instance, in predicting revenue (Sales), the model considers trends in recent sales activity and seasonal factors like increased sales during holidays. Moreover, by incorporating related metrics like the volume (Quantity Purchased), the model understands and accounts for how changes in these related metrics influence the main measure, thereby refining its forecasts accordingly.
Best practices
The following are practices to get the best quality forecasting results:
-
Please ensure you have sufficient data points visualized in your time-series metric, the machine learning (ML) model needs to see at least two cycles (preferably three or more) of a required seasonality. For example, if you have plotted a Monthly time-series KPI chart, you should have at least 24 data points for the ML model to pick up yearly seasonality.
-
You can enhance the model by selecting additional measures that could impact the target metric. Exercise caution in this approach; refrain from adding extra columns unless you intend to model the relationships between them and are not solely focused on the trends of the target variable.
Limitations
-
Forecasting is only available for time-series KPI charts.
-
Forecasting can only be done on charts whose data sources are cloud data warehouses.
-
You need at least 15 data points in your time series KPI to forecast.
-
Forecasting is not supported on datasets that have custom calendar configurations.
-
When you enable Forecasting, you will only be able to run one kind of SpotIQ analysis at a time. If you disable Forecasting, you will be able to multi-select.
-
On forecasting the user cannot explore, drill down or see the underlying data for the forecasted data.
-
Forecasting charts can’t be pinned to Liveboards, export as PNG or CSV.


