Worksheets
ThoughtSpot uses worksheets, which are logical views of data, to model complex datasets. The worksheets simplify access to data for end-users and application services by incorporating these key features, and more:
-
Table joins supplement the primary data with information from various other data sources.
-
Changing data types ensures that you can handle mismatches gracefully, For example, conversions of date/time type formats, and processing of numeric codes (such as event IDs) correctly.
-
Derived fields support flexible expressions and formulas.
-
Renamed fields make charts and tables easily accessible.
-
Selecting fields allows you to focus only on the fields that are necessary to the business use case.
-
Hiding fields lets you change the visibility of data by obscuring and securing sensitive information without affecting the calculations that depend on it.
-
Changing the default aggregation of fields in a worksheet prevents common mistakes when building visuals.
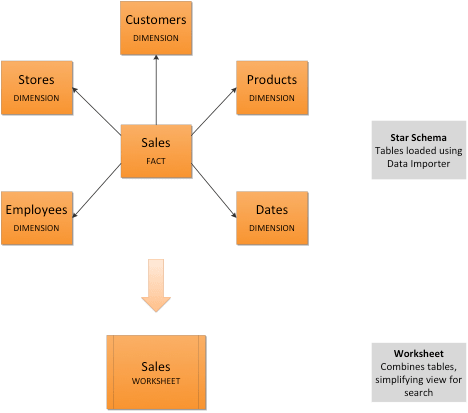
After modeling your data, create worksheets to make searching easier. For example, a sales executive might need to search for information about retail sales. This data might be contained in several tables (sales, customers, products, stores, and so on), with foreign key relationships between them. An administrator who is familiar with the data model can create a retail sales worksheet, that combines all of the related fact and dimension tables into a single, easy-to-use view, and share it with the sales executive. This provides access to the data without requiring an understanding of how it is structured.
Guidelines for worksheets
Users are often unfamiliar with tables and how they are related to one another. A worksheet groups multiple related tables together in a logical way. You might use a worksheet for these reasons:
-
To pre-join multiple tables together.
-
To give a user or group access to only part of the underlying data.
-
To include a derived column using a formula.
-
To rename columns to make the data easier to search.
-
To build in a specific filter or aggregation.
-
To give users a filtered set of data to search.
Typically, you create one worksheet for each set of fact and dimension tables. For example, you may have a sales fact table and an inventory fact table. Each of these fact tables shares common dimensions like date, region, and store. In this scenario, you would create two worksheets: sales and inventory. The following diagram depicts the workflow for creating the sales worksheet.
The process for creating a worksheet is:
-
Decide which tables to use for the worksheet.
-
Create a worksheet. If the worksheet already exists in another cluster, you can migrate it using a flat
TMLfile. -
Add sources (tables) to the worksheet.
-
Choose the worksheet join rule.
-
Select the columns to include.
-
Optionally modify the join types within the worksheet.
-
Optionally create a formula in a worksheet.
-
Optionally create worksheet filters.
-
Save the worksheet.
-
Model the worksheet for search: rename columns, add descriptions, and set aggregation types. See Data modeling settings.


