Save and share R visualizations
You can save and share R analyses as answers and Liveboards.
In terms of sharing, the R visualization you get as a result of running a script is similar to any other search result in ThoughtSpot. You can save it, share it, and add it to Liveboards.
| We support R only in Falcon deployments (data imported into ThoughtSpot), and R integration is disabled by default. It is not available when creating connections and linking to external databases in real time. |
Save an R visualization
-
Click the more options icon
 above the generated graphic or table containing your analysis, and select Save from the menu.
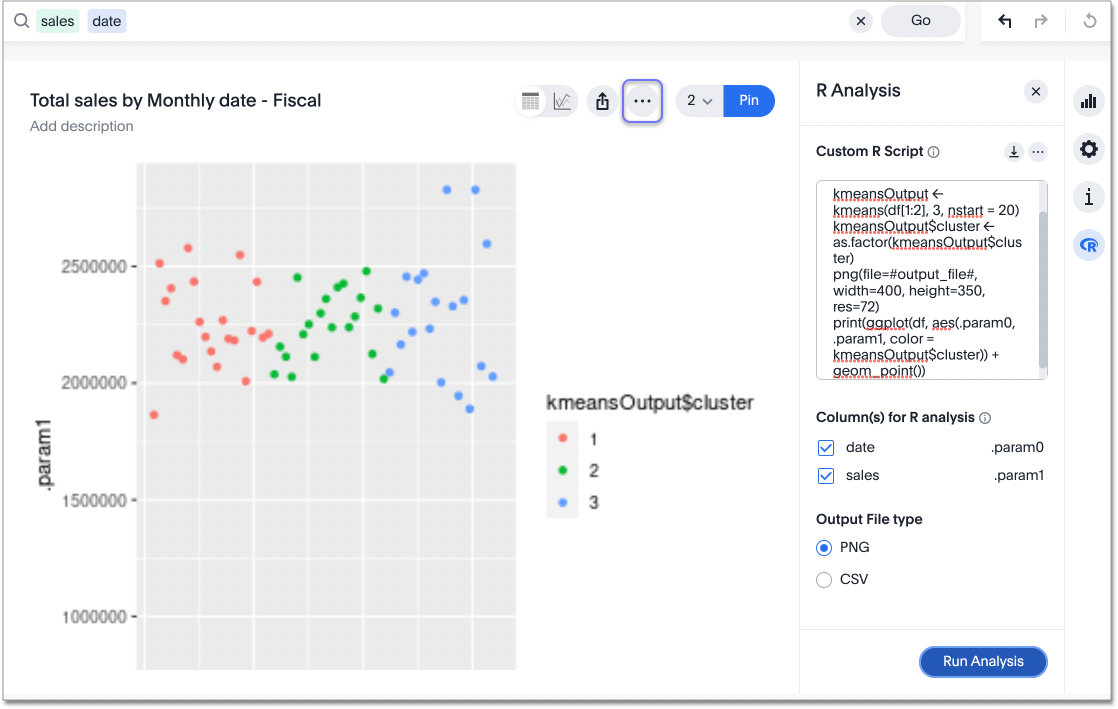
-
Add a name and description for the analysis, and select Save. The saved analysis is added to Answers.
Share an R visualization
-
Select the Share icon
 .
above the generated graphic or table containing your analysis.
.
above the generated graphic or table containing your analysis. -
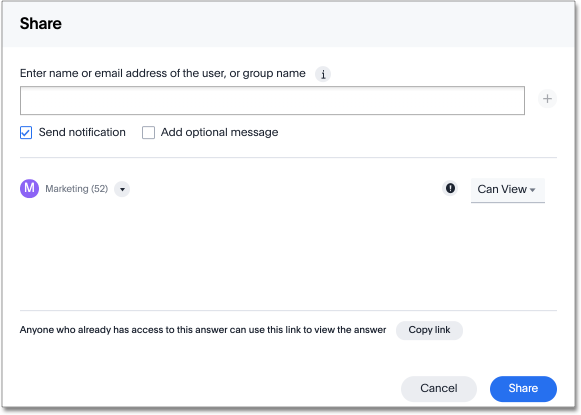
Select and add the user or group with which to share, along with level of access (Can View, Can Edit), and then click Done.
Add an R visualization to a Liveboard
-
Select the Pin button above the generated graphic or table containing your analysis.
-
Create a new Liveboard or select an existing Liveboard, then click Done. You can find the visualization in Liveboards.


