Treemap charts
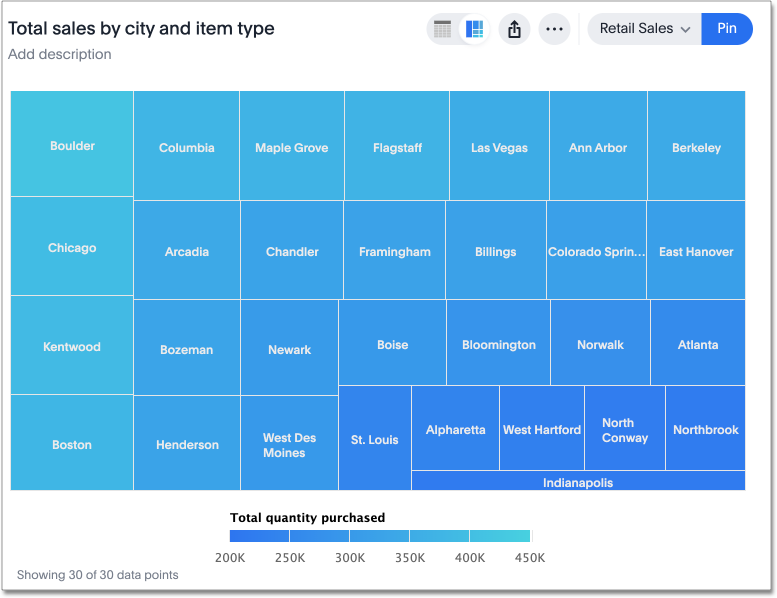
The treemap chart displays hierarchical data as a set of nested rectangles.
Treemap charts use color and rectangle size to represent two measure values. Each rectangle, or branch, is a value of the attribute. Some branches can contain smaller rectangles, or sub-branches. This setup makes it possible to display a large number of items in an efficient way.
You can rearrange the columns of your search into category, color, and size under Edit chart configuration.
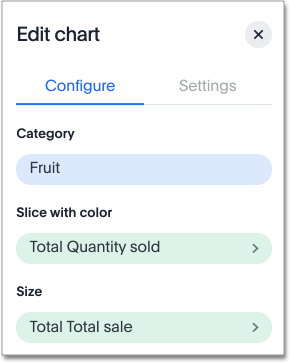
Your search needs at least one attribute and two measures to be represented as a treemap chart.
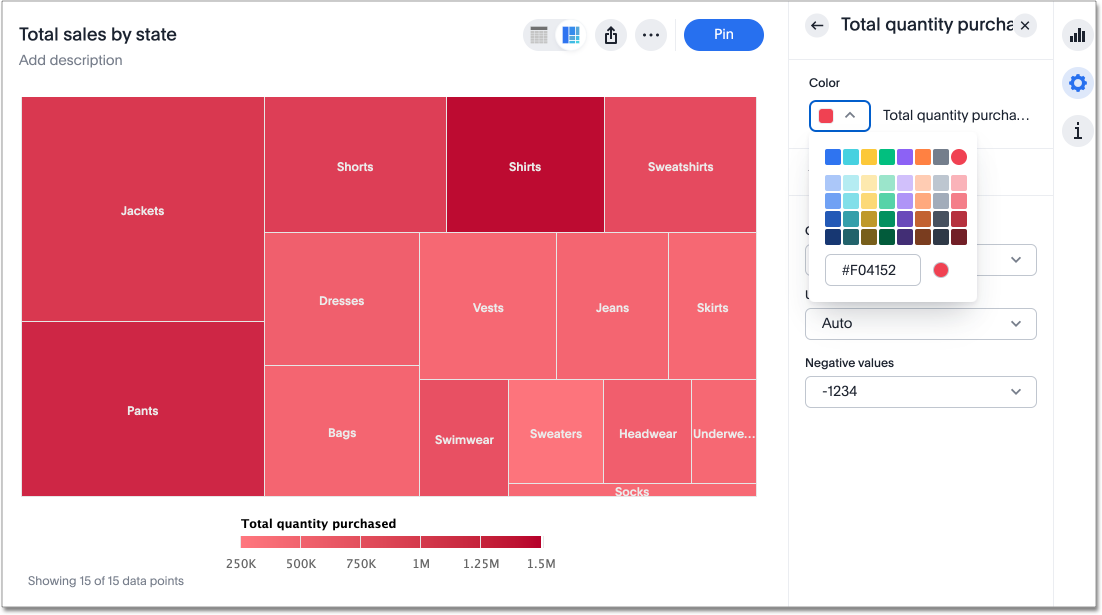
Change treemap color
By default, the treemap color is blue in various shades. You can change the treemap color under chart configuration. To change the basic color the treemap uses, follow these steps:
-
Navigate to any treemap chart that you have edit privileges for.
-
Select the edit chart icon
 on the left side of your screen.
 -
Select the chip for the measure under Slice with color.
-
Click the Color dropdown, and select one of the options in the color palette.