Falcon monitor Liveboards
Use the Falcon Monitor Liveboards for an overview of Falcon, ThoughtSpot’s in-memory database, and its health, based on query, data load, system stats, and varz metrics.
In ThoughtSpot release 6.2, there are 5 new Liveboards, based on Falcon metrics, that are available to system administrators.
Falcon is ThoughtSpot’s in-memory database. Falcon monitoring functionality pushes different kinds of metrics to Falcon system tables every fifteen minutes. These system tables, when updated, update the 5 new Liveboards that you can use to monitor Falcon’s health. You can see these Liveboards from the Liveboards page, by searching for 360_Overview:
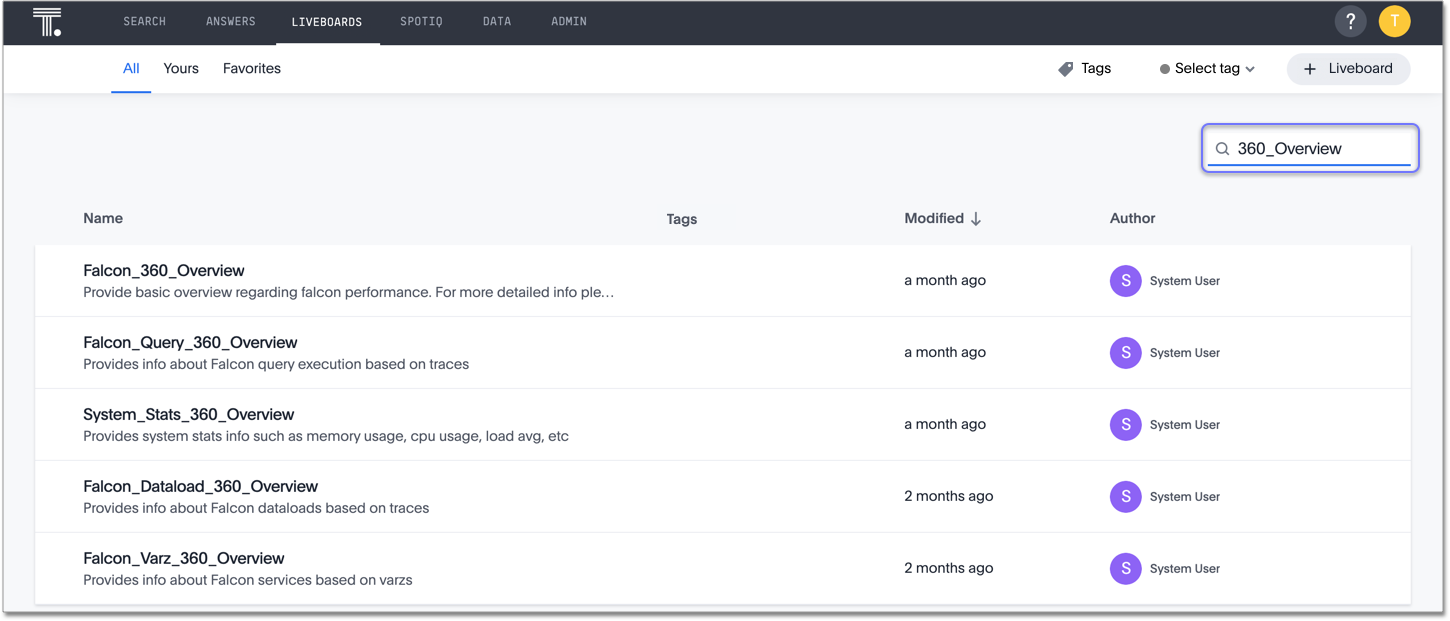
The 5 new database monitoring Liveboards are: Falcon_360_Overview, Falcon_Query_360_Overview, Falcon_Dataload_360_Overview, Falcon_Varz_360_Overview, and System_Stats_360_Overview.
You can use these Liveboards for proactive monitoring, or, with help from ThoughtSpot support, for debugging.
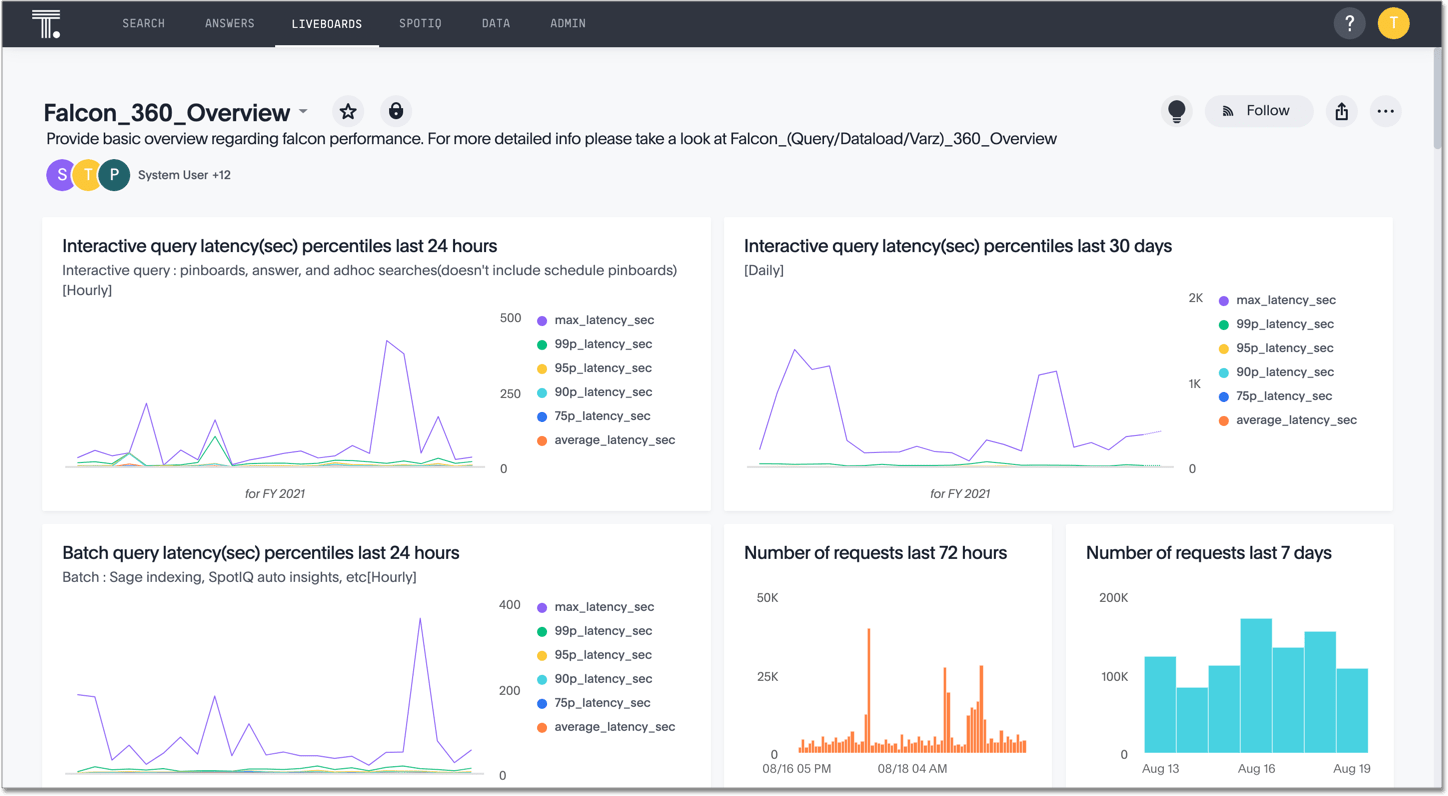
Falcon_360_Overview
This Liveboard provides basic information regarding Falcon’s performance and health. Visualizations include Interactive query latency(sec) percentiles last 24 hours, Dataload : Avg Ingestion Speed (# Rows Ingested / Load Time) Per Hour - Last 72 Hours, CPU Utilization (System, Idle, User) - Last 72 Hours, Dataload Frequency By Hour Of Day (Aggregated over 7 days), Top 10 frequently changed Liveboard vizes, and so on.
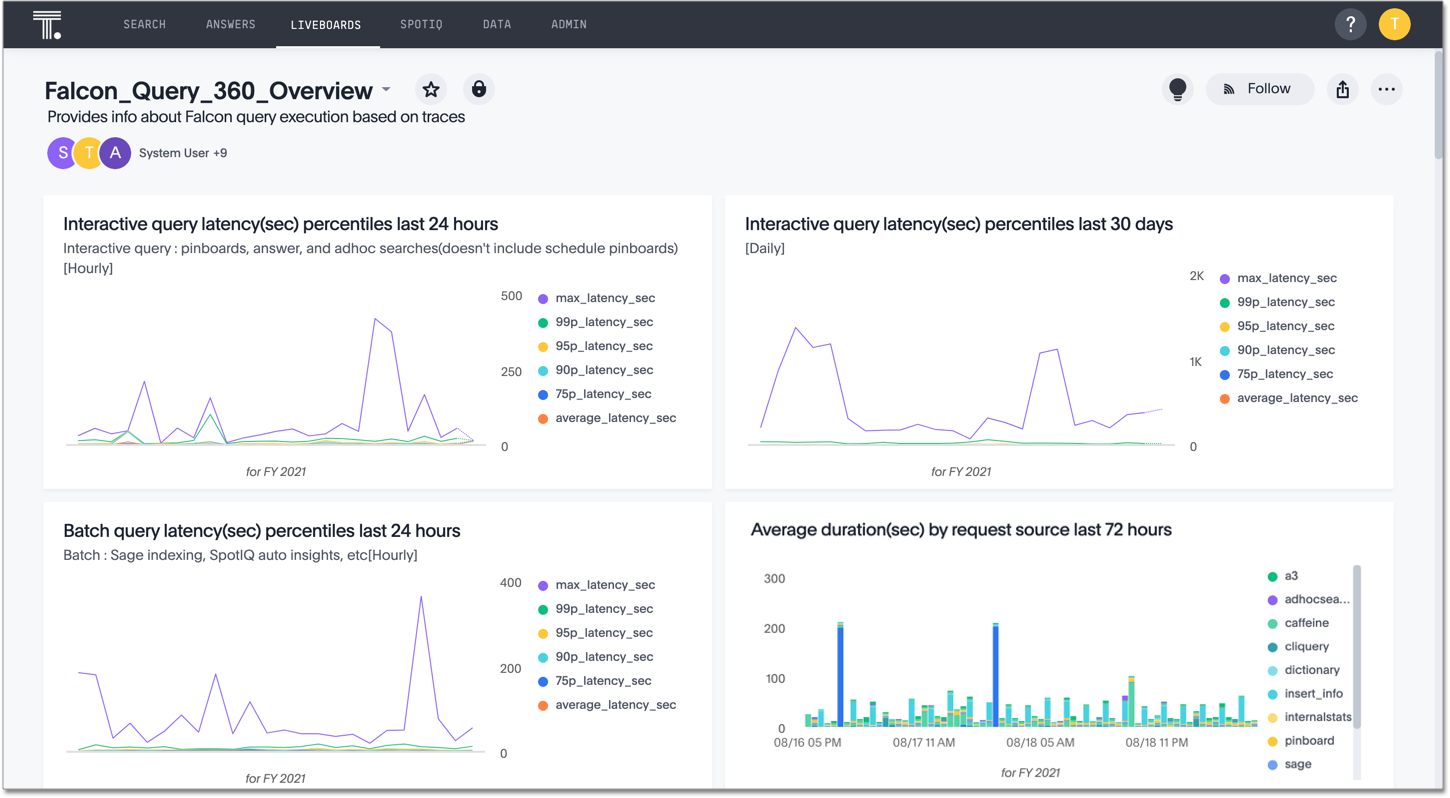
Falcon_Query_360_Overview
This Liveboard provides information about Falcon query execution based on traces. Visualizations include Interactive query latency(sec) percentiles last 24 hours, Average duration(sec) by request source last 72 hours, Median latency(sec) by hour of the day last 7 days, Count of trace ids by error status last 72 hours, Max JIT compilation time(sec) last 72 hours, Top 10 vizs based on avg duration(sec), and so on.
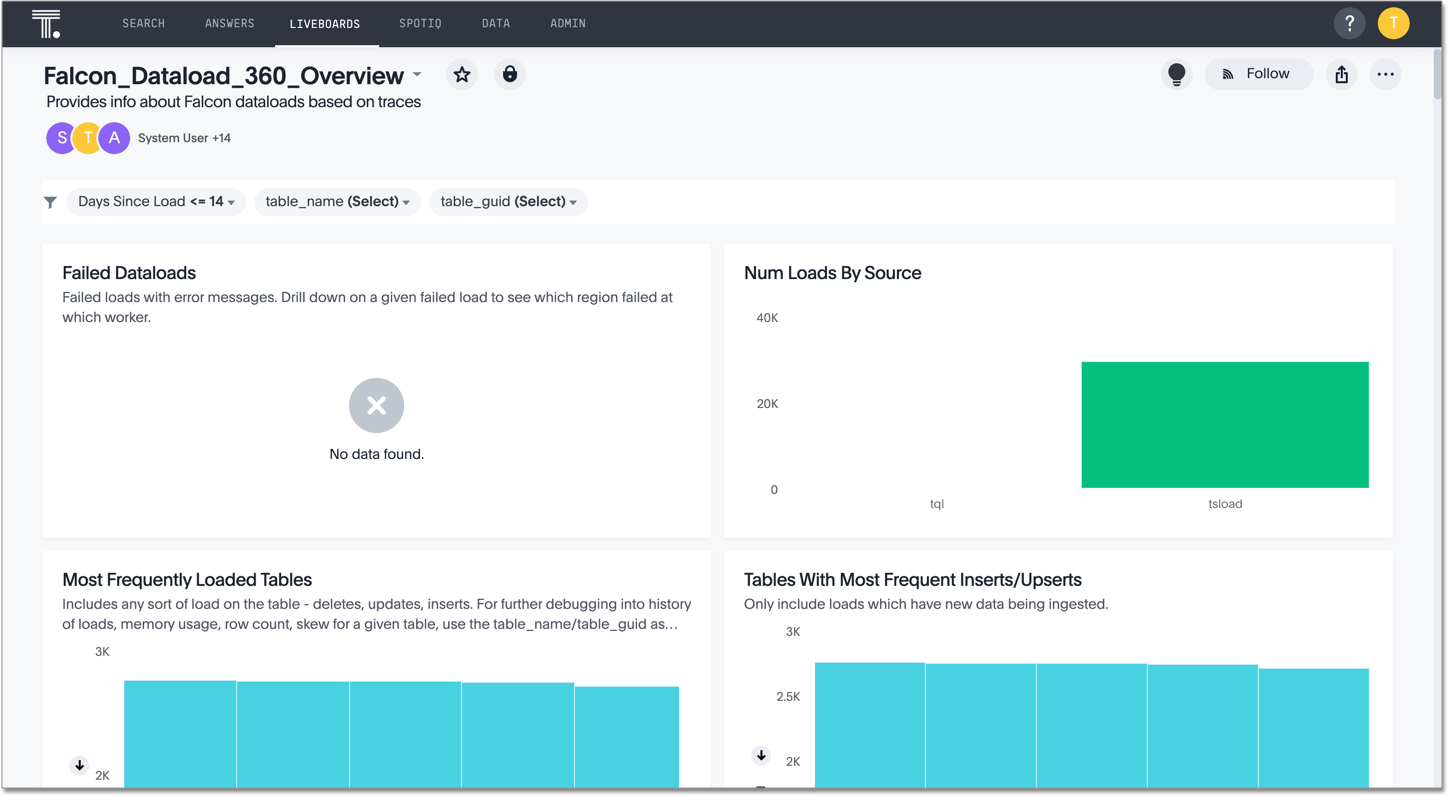
Falcon_Dataload_360_Overview
This Liveboard provides information about Falcon data loads based on traces. Visualizations include Failed Dataloads, Tables With Most Frequent Inserts/Upserts, Table Growth (# Rows) Over Time, Load Frequency By Hour Of Day (Aggregated in a time window), Slowest Loads & Corresponding Region Load Time Skew, Loads With Highest Compaction Overhead (# Rows) and so on.
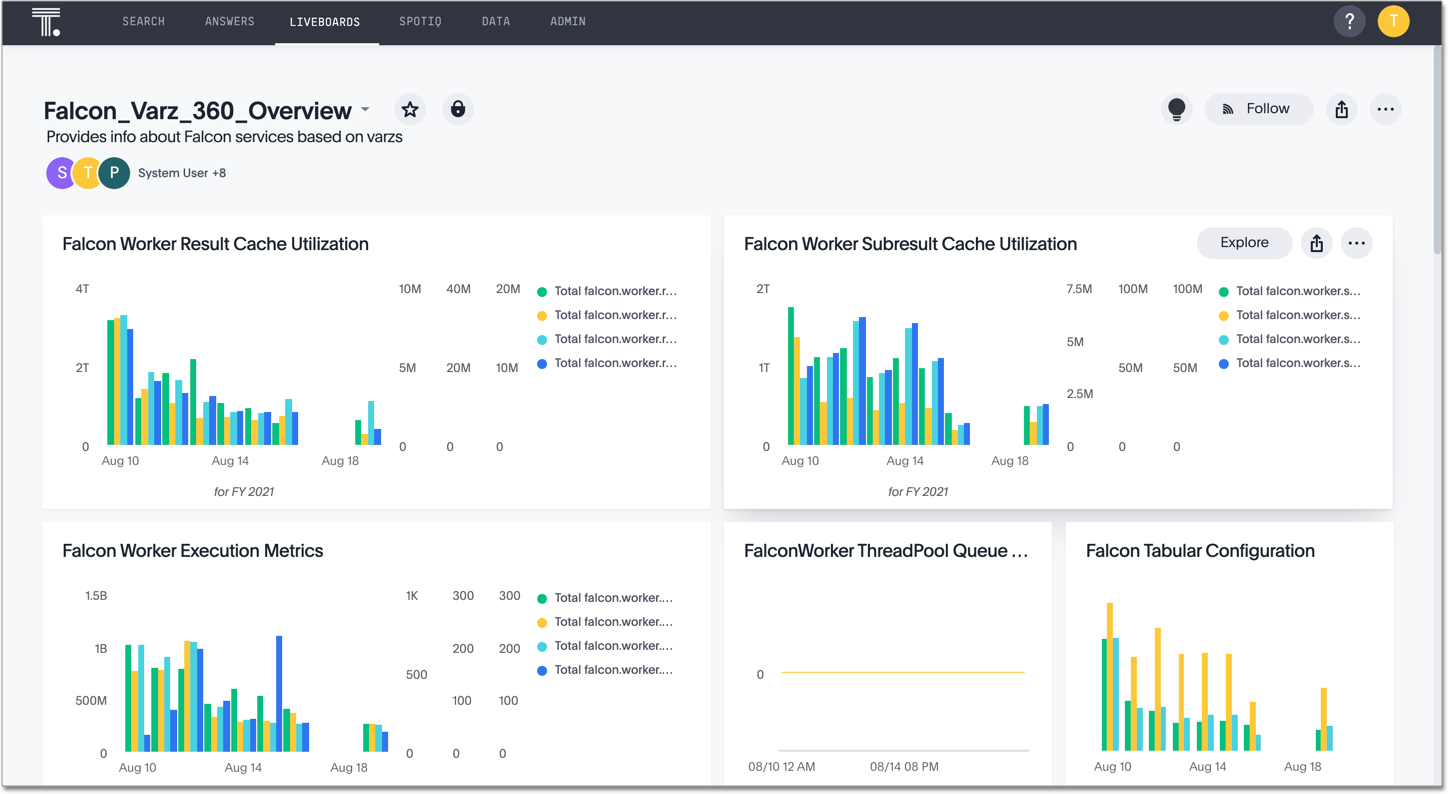
Falcon_Varz_360_Overview
This Liveboard provides information about Falcon services based on metrics in VarZ format. Visualizations include Falcon Worker Execution Metrics, Falcon Query Runtime (Average and Max), Falcon Worker Memory Manager, Daily Data Load Statistics, Falcon Compiler Cache Daily Usage, and so on.
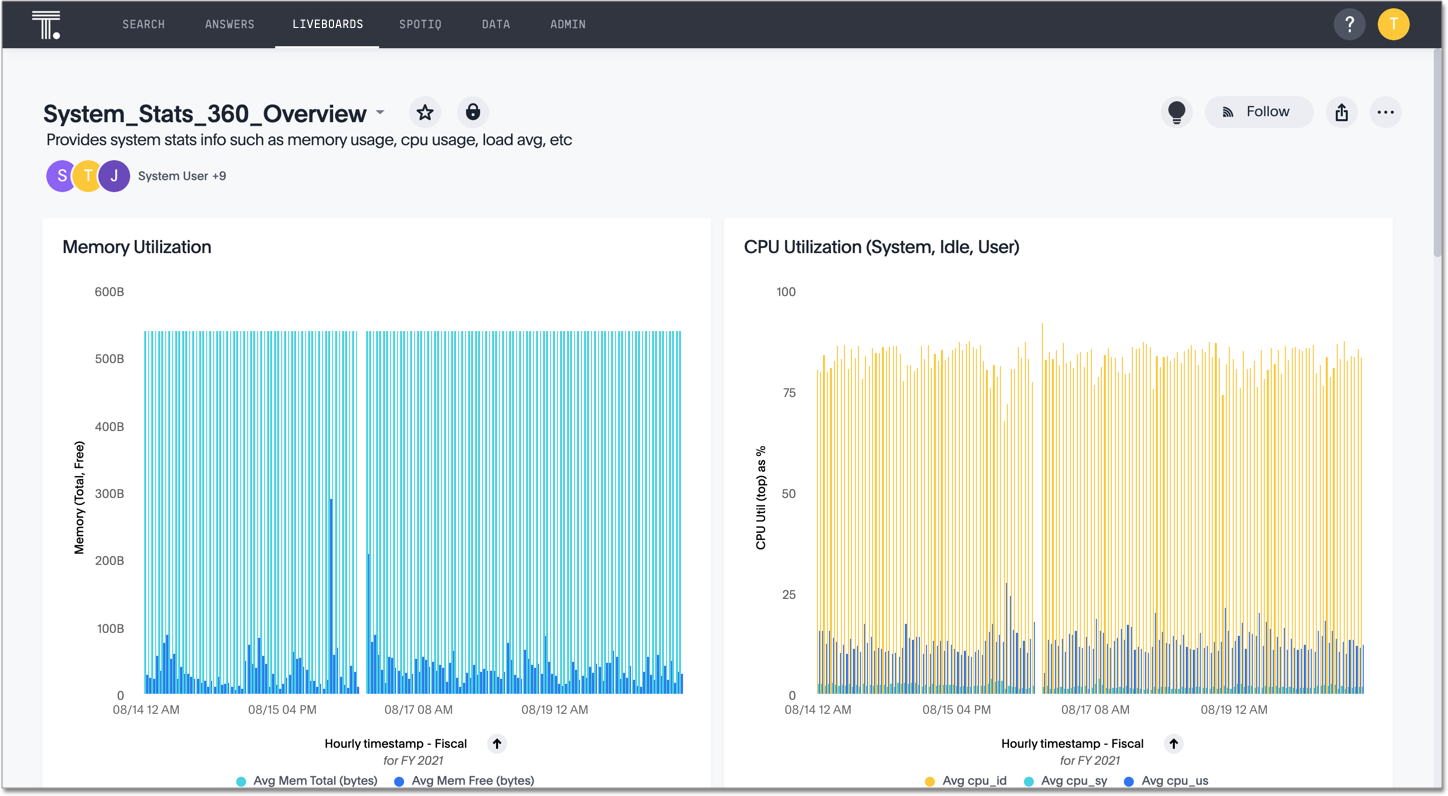
System_Stats_360_Overview
This Liveboard provides system stats information such as memory usage, CPU usage, and load average. Visualizations include Memory Utilization, CPU Utilization (System, Idle, User), Loadavg (current/total scheduling entities), Memory (Free), Netstat connections, and so on.