Show data labels
You can show data labels for every measure in your chart, or configure labels separately for each measure.
Configure all data labels
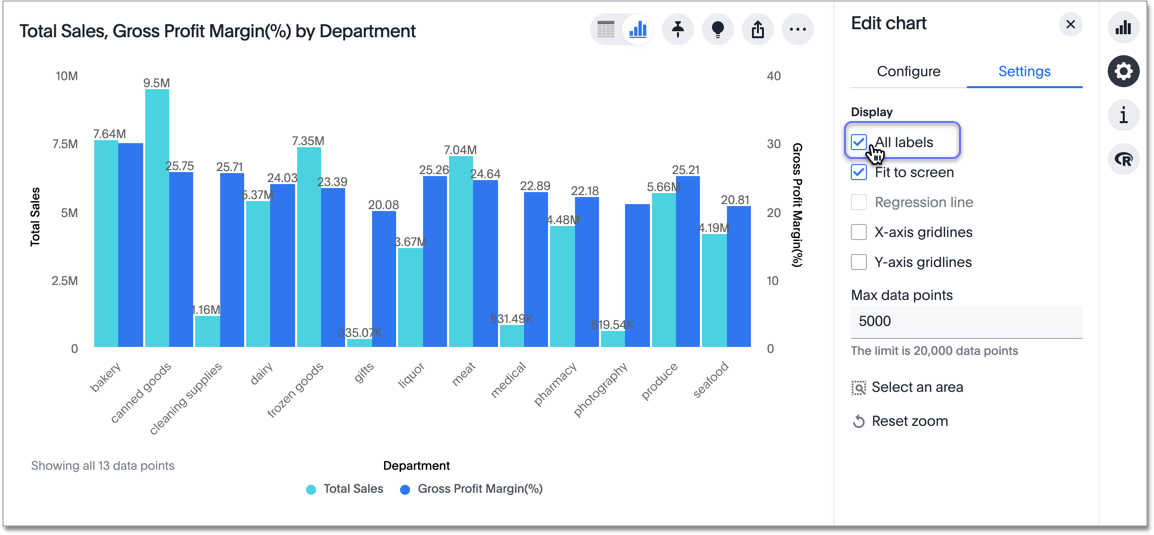
To turn on all data labels for a chart, click the edit chart configuration ![]() icon, and select the Settings menu.
Select all labels.
Note that you cannot select all labels when you fit to screen, unless the visualization does not have enough data points to require a scroll bar, and thus defaults to fit to screen mode.
icon, and select the Settings menu.
Select all labels.
Note that you cannot select all labels when you fit to screen, unless the visualization does not have enough data points to require a scroll bar, and thus defaults to fit to screen mode.
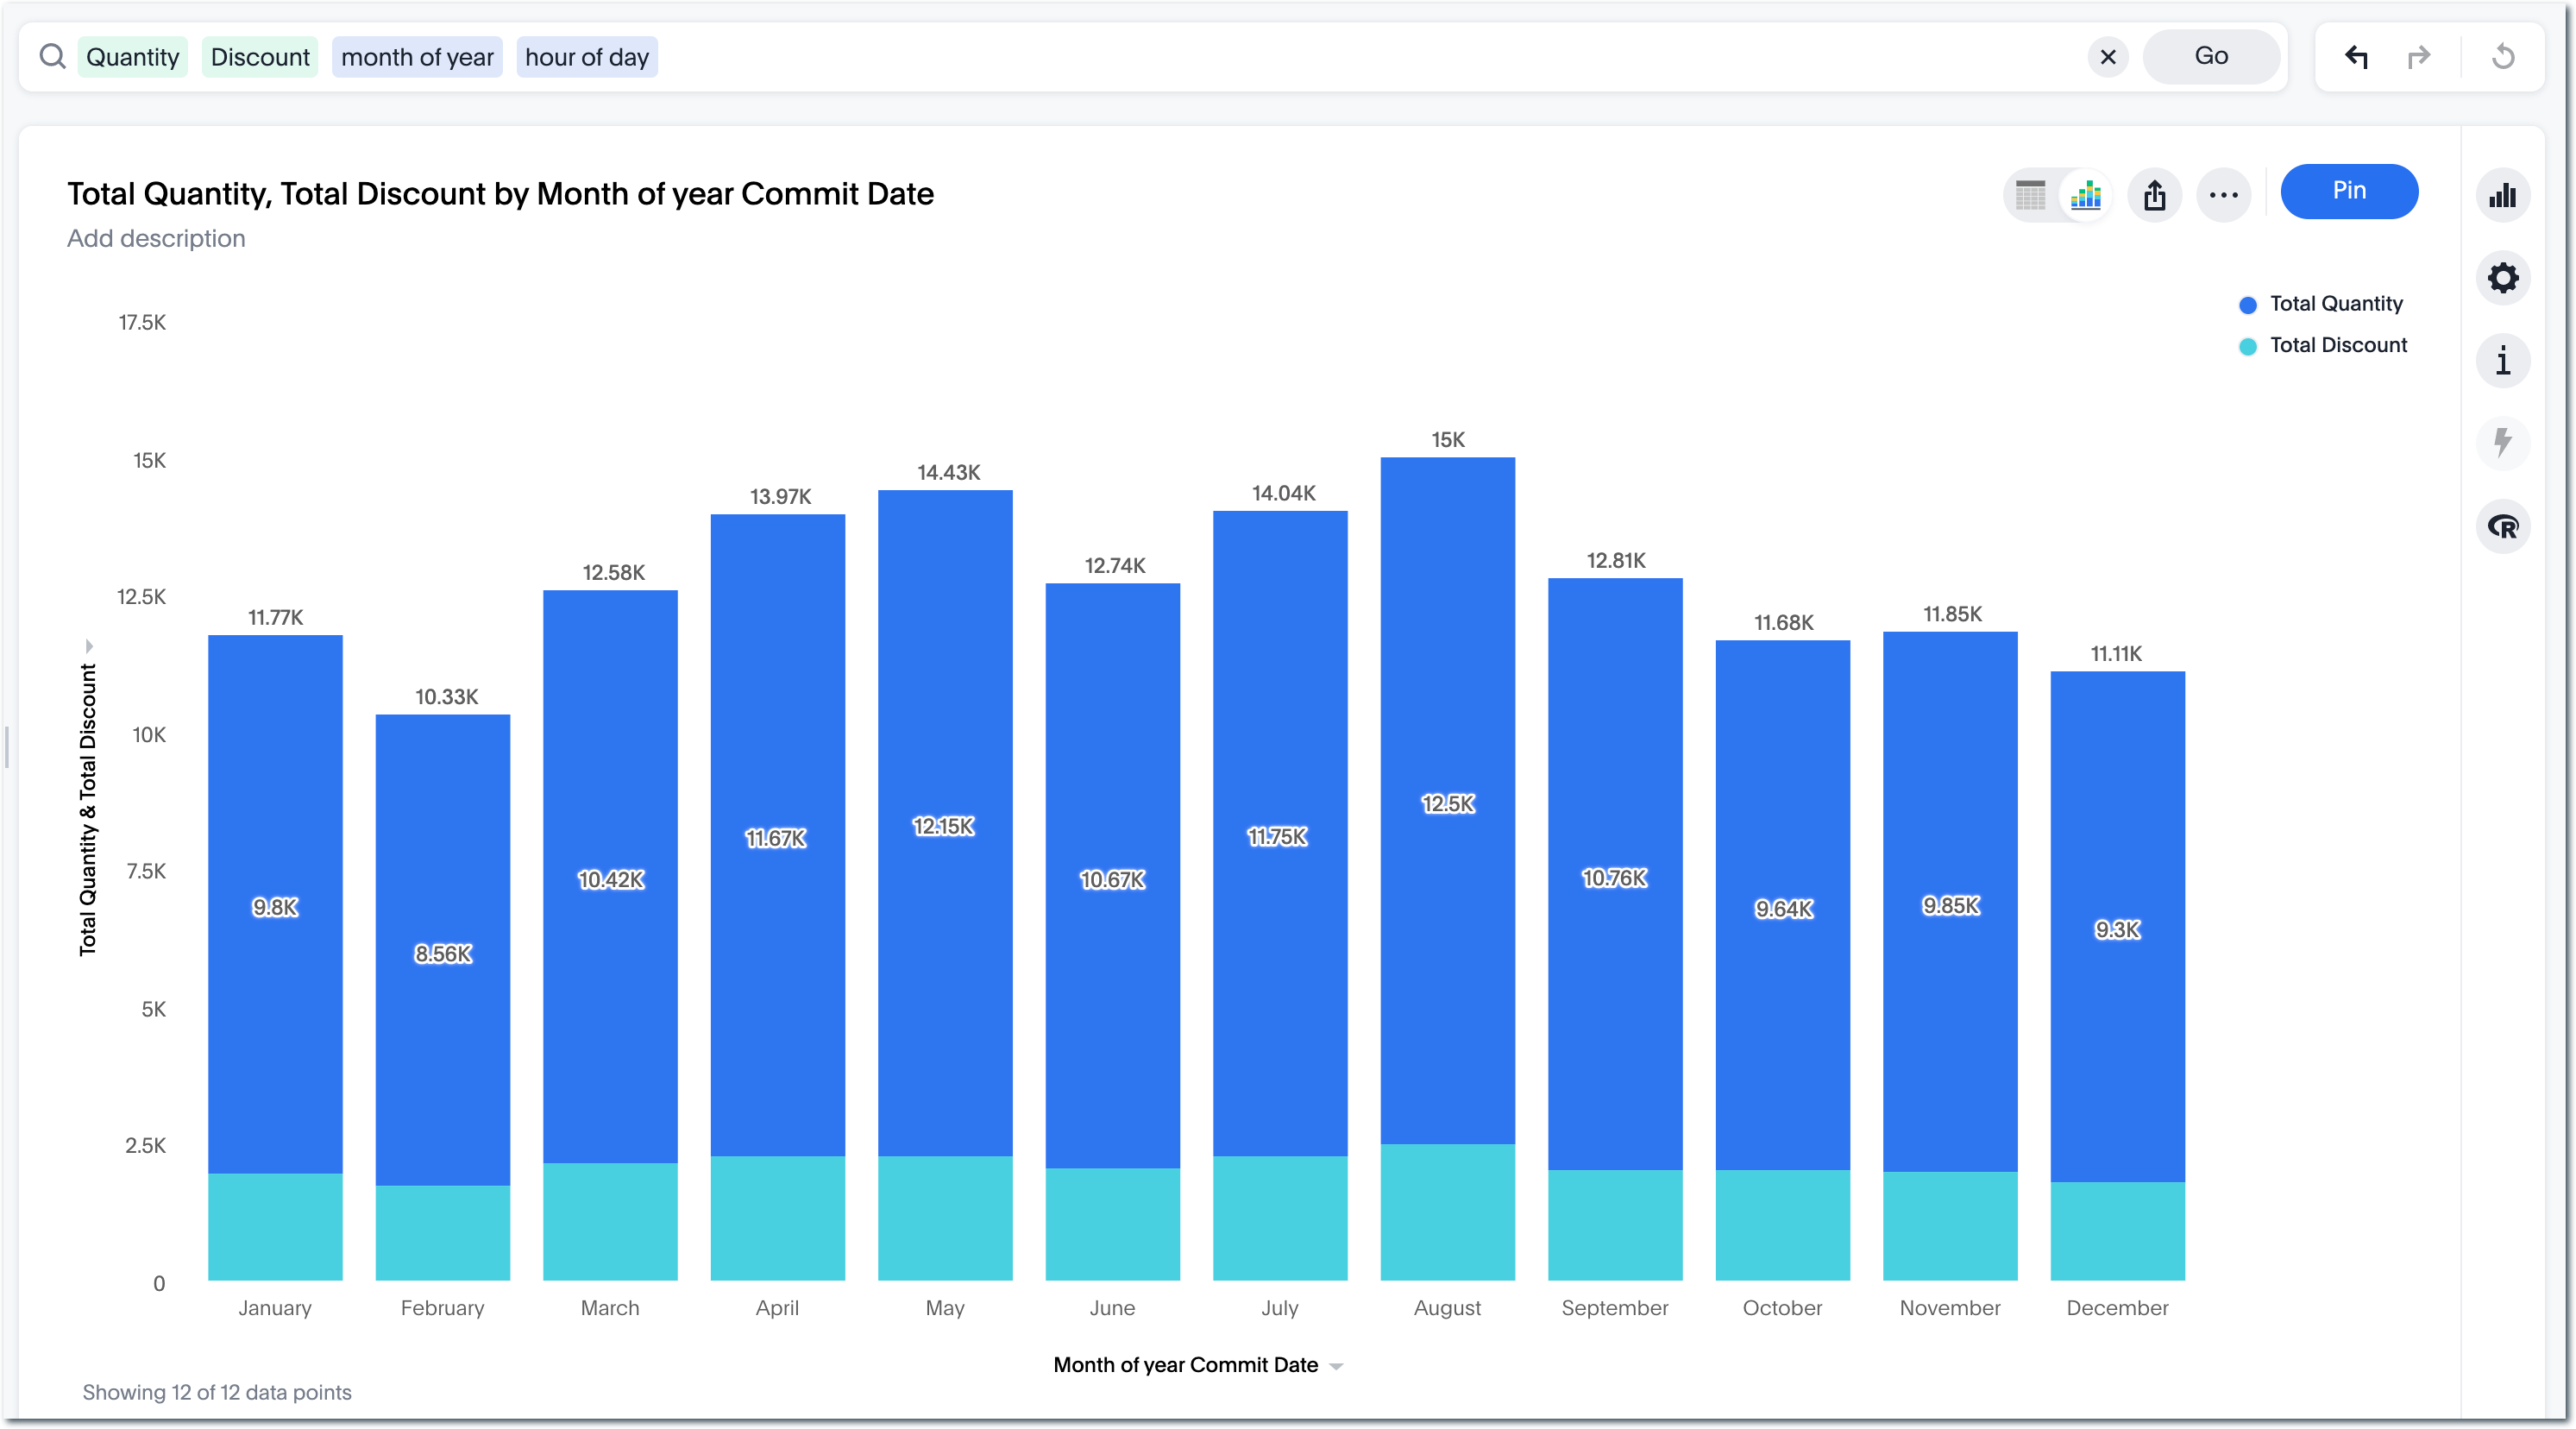
To further configure the labels, by showing unrounded numbers for example, configure labels individually.
Labels that appear on a dark background can be displayed in a lighter text color, making them easier to read.
This feature is disabled by default. To enable it, contact your ThoughtSpot administrator. For more about Early Access features, see ThoughtSpot Software release life cycle.
Configure labels for one measure
-
While viewing your search or answer as a chart, select the chart configuration icon
 on the upper right.
 -
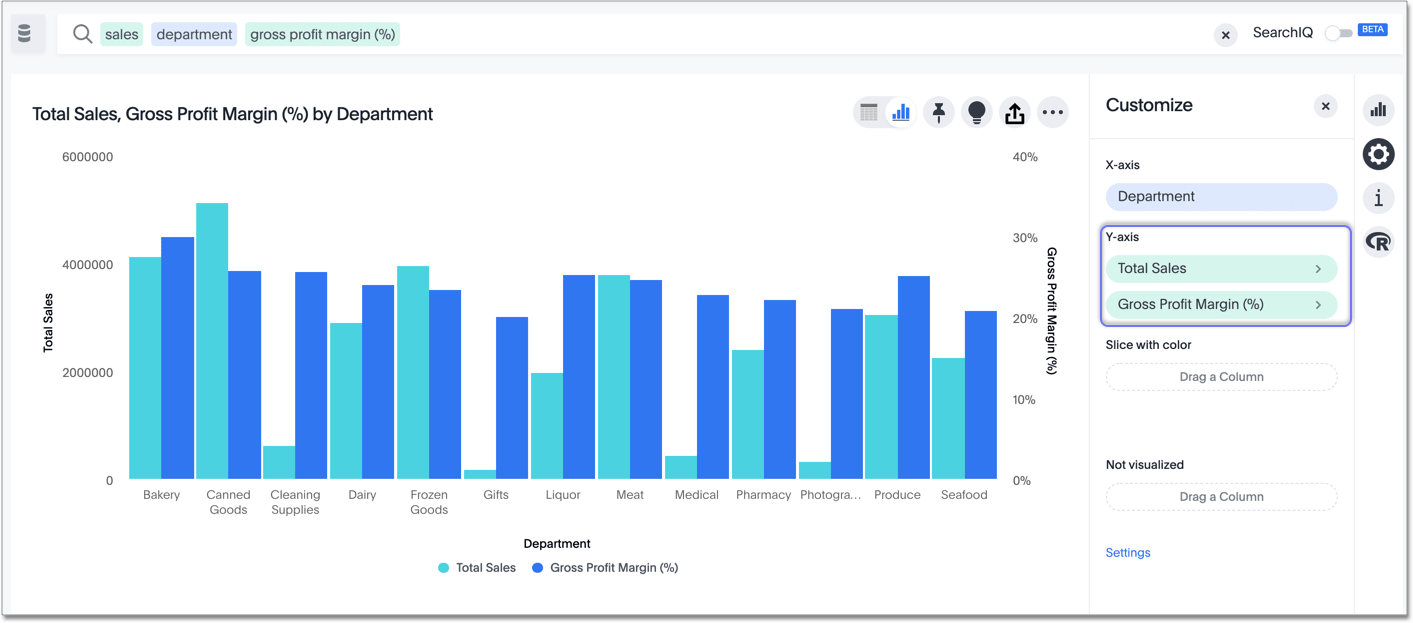
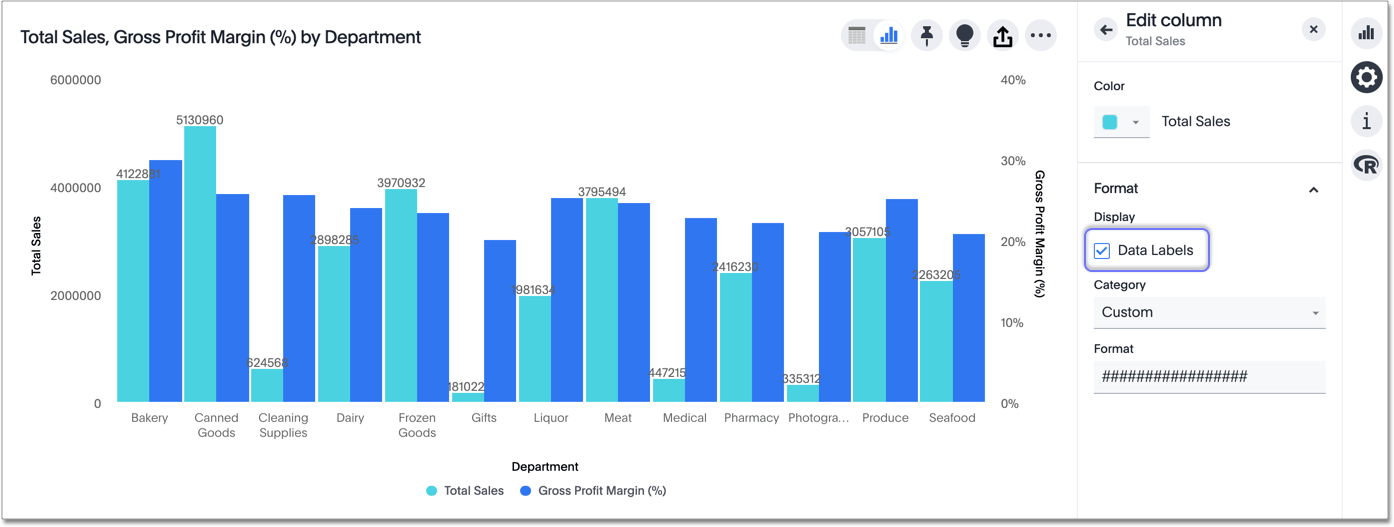
Select the measure you want to add labels to.
-
Check the data labels box.
Note that only the total sales data has labels.
-
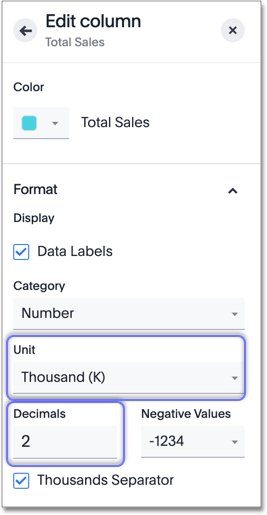
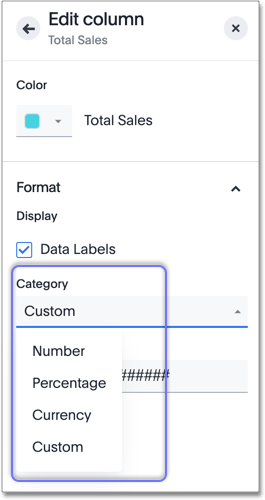
You can specify a category, like number, percentage, or currency. Otherwise, ThoughtSpot automatically picks the best category for your data.
-
When you specify a category, you can also specify units. Select none to see your data down to two decimal points, for example, or select millions to see labels rounded to the millions.
You can also specify the number of decimal places.