Custom SpotIQ analysis
Everywhere in ThoughtSpot where you can run SpotIQ analyze, you can configure a customized SpotIQ analysis. The customized analysis can be a one-time customization or can apply to all future analysis of that particular data source.
Finding customization controls
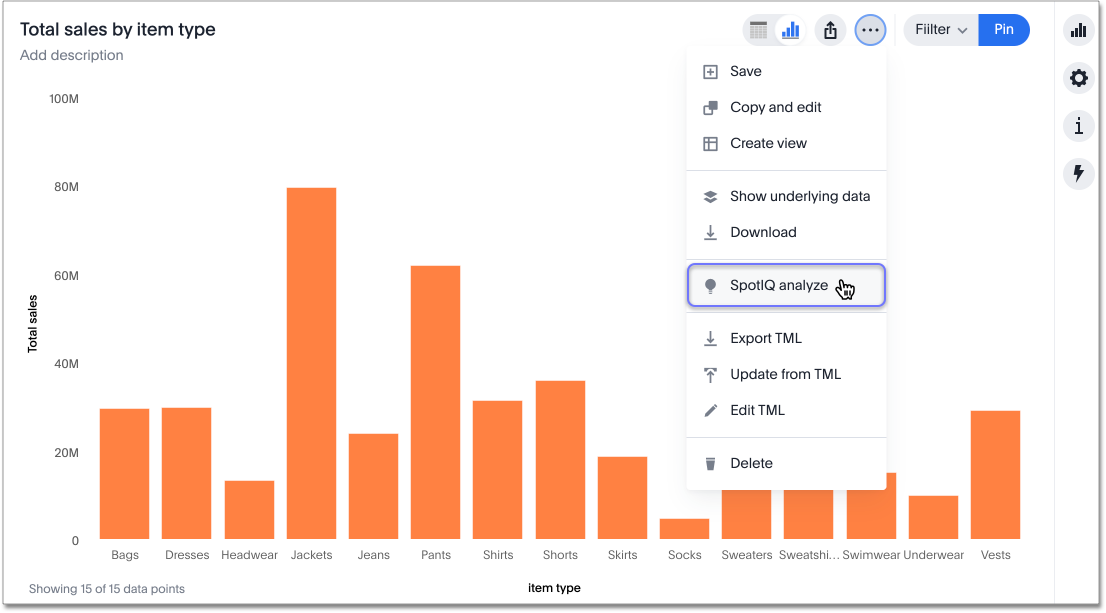
Every menu or location where you can run SpotIQ analyze, you can customize your analysis.
You access it from the more menu ![]() > SpotIQ analyze.
> SpotIQ analyze.
SpotIQ window layout
Depending on whether you are using the new answer and Liveboard experiences or the classic experiences, the SpotIQ analysis window has a different layout.
SpotIQ in the new answer and Liveboard experiences
-
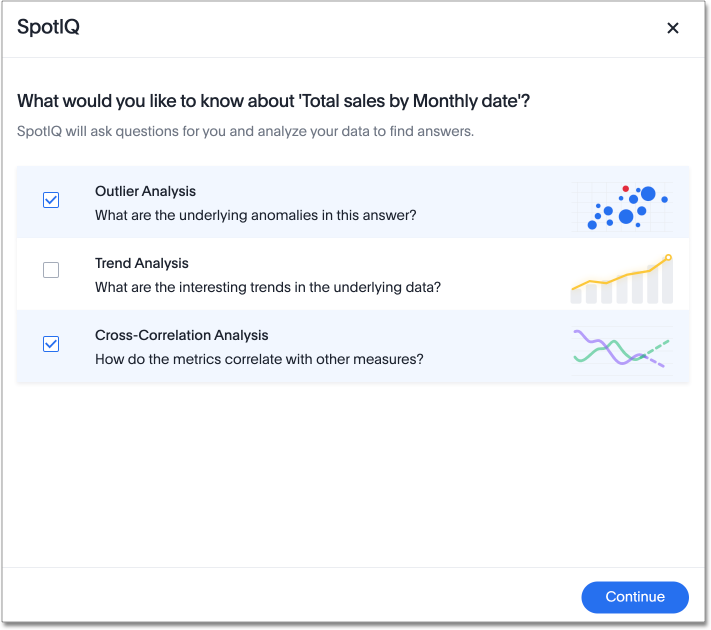
On the new answer and Liveboard experiences, the SpotIQ analysis window first asks you what kind of analysis you would like to do:
-
Outlier analysis: finds underlying anomalies or outliers
-
Trend analysis: finds interesting trends in the underlying data
-
Cross-correlation analysis: determines how your metrics correlate with other measures
-
Change analysis: if you select 2 or more data points, you can run a change analysis on those points. Otherwise, ThoughtSpot does not show you this option.
-
-
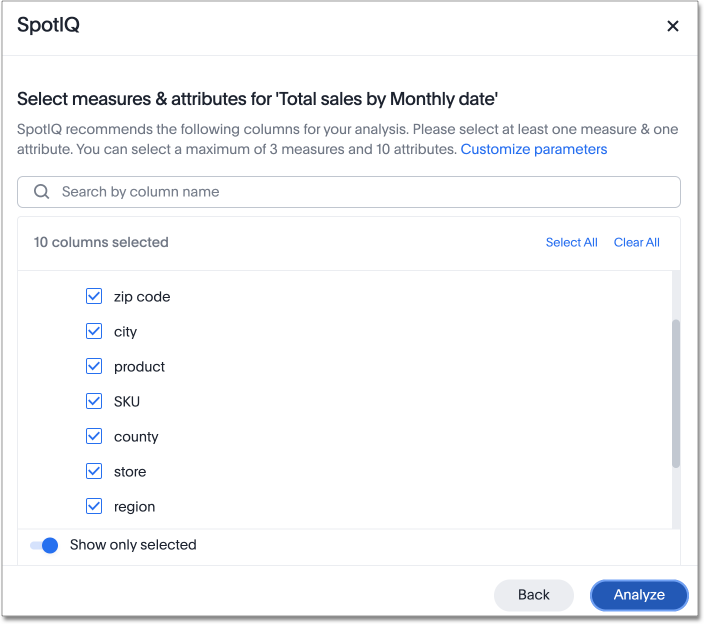
Next, SpotIQ recommends certain columns for analysis. You can select all columns in the answer, clear all columns, or search for more columns to include.
-
You can also customize advanced parameters. Select Customize parameters, on the Select measures and attributes page. The following screen appears. Scroll down to see more options, including customizations for specific analysis types.
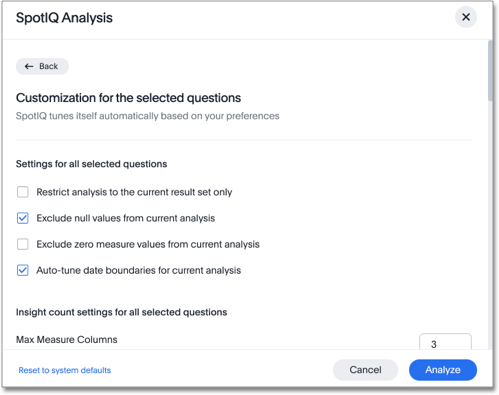
You can customize the following parameters for any SpotIQ analysis except a change analysis:
-
General settings: exclude null values, restrict analysis to the current result set only, exclude zero values, or auto-tune date boundaries
-
Insight count settings: choose the maximum number of measure and attribute columns to analyze
You can customize the following parameters for an outlier analysis:
-
Outlier algorithm: choose the method of outlier detection (z-scores or median z-scores, Seasonal Hybrid ESD, or Linear Regression)
-
Outlier parameters: choose the minimum rows required for analysis, multiplier for outlier detection, and maximum P-Value
-
Insight count settings: choose the maximum outlier detection insights, maximum seasonality detection insights, and maximum linear regression insights
You can customize the following parameters for a trend analysis:
-
Trend parameters: specify the minimum rows required for analysis, maximum P-Value, and minimum relative difference
-
Insight count settings: specify the maximum trend insights
You can customize the following parameters for a cross-correlation analysis:
-
Cross-correlation parameters: choose the minimum rows required for analysis, minimum correlation coefficient, maximum correlation coefficient, and maximum correlation lag
-
Insight count settings: choose the maximum cross-correlation insights
You can customize the following parameters for a change analysis:
-
Change analysis parameters: specify the maximum difference elements, the maximum fraction, minimum abs change ratio, and minimum change ratio
-
SpotIQ in the classic answer and Liveboard experiences
In the classic Answer, Liveboard, or SpotIQ experience, the SpotIQ analysis window has two tabs:
-
Columns, where you can explicitly indicate which columns to include in a SpotIQ analysis. (You can select all, some, or none.)
-
Advanced, where you can run custom analyses and incorporate R scripts Deprecated 8.4.0.sw [LA] into SpotIQ.
The Advanced tab has many options. The panel scrolls, so more algorithms are available than appear in the following image.
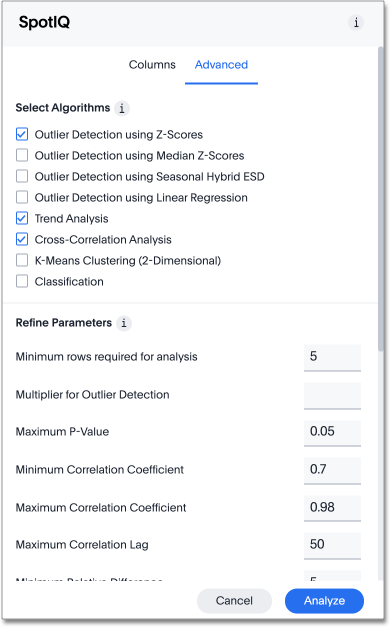
The SpotIQ insights page has an option to open this window to customize a single analysis.
The Tell us more window provides information on how to exclude a value from all future analysis.
You can set SpotIQ customization parameters in your SpotIQ preferences, along with options for email notifications when analyses run:
- Eliminate null values
-
Null values should be eliminated from your analysis.
- From next analysis
-
In the Search bar, add a filter
column!= Nullto the search bar. Or choose Exclude null values from current analysis, using the Advanced panel. - From future analyses
-
Set Exclude null values from my analysis on your user Profile to exclude them from any future SpotIQ analyses you do.
- Exclude uninteresting column(s) in insight
-
You should always exclude columns you are not interested from your analysis.
- From next analysis
-
Use the EXCLUDE option of SPOTIQ PREFERENCE under the DATA tab to exclude any column permanently from all future analysis.
- From future analyses
-
Not applicable.
- Include an interesting column
-
You can always include columns that interest you in your analysis.
- From next analysis
-
Choose Customize analysis and select columns that you want to include.
- From future analyses
-
Ensure Index Priority is between 8-10 on the column under the DATA tab.
- Remove known date outliers
-
Your data may contain known outliers.
For example, you are in the middle of a quarter and only want to analyze the previous quarter. Anything from the present quarter could contain an outlier.
- From next analysis
-
In the Search bar, add a filter date< last time period to the search bar.
- From future analyses
-
Not applicable.
- Too few insights
-
Your SpotIQ analysis may not provide you as many insights as you think it should.
- From next analysis
-
Choose Customize analysis, select the Advanced tab, and decrease the Multiplier for Outlier Detection to a value closer to zero.
- From future analyses
-
Not applicable.


