User Adoption Liveboard
Use the User Adoption Liveboard to understand how your users are interacting with ThoughtSpot, and how your user adoption is changing over time.
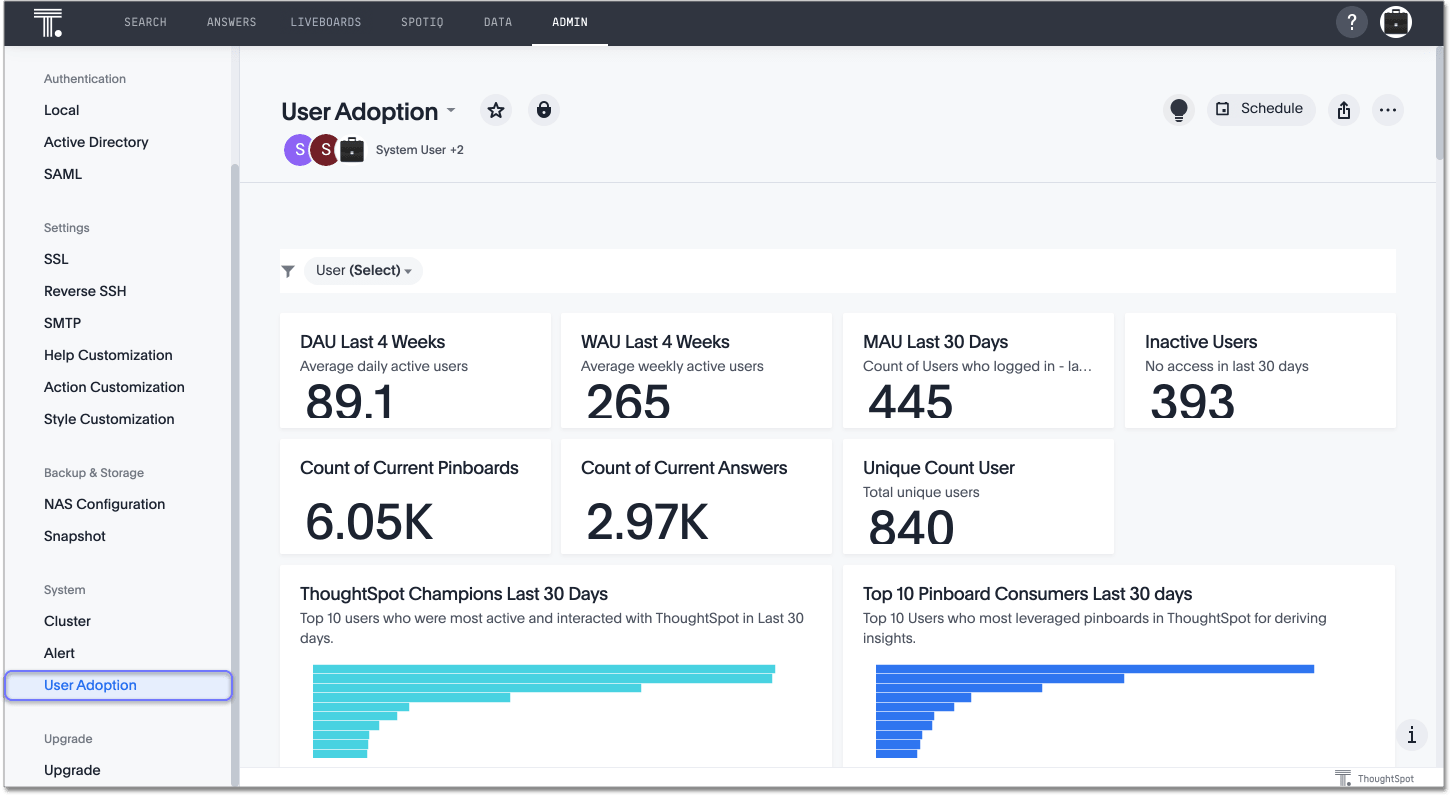
The User Adoption Liveboard contains essential information about your ThoughtSpot users and their adoption of the platform. Use this Liveboard to understand weekly active users, inactive users, top 10 ad hoc searchers, popular Liveboards, and so on. You must have admin privileges to view this Liveboard.
Users with admin privileges can share system Liveboards, such as the User Adoption Liveboard, with other users who do not have admin privileges. However, be aware that you may be sharing sensitive user-level information, such as the names of objects that a user accessed.
To view this Liveboard, navigate to the admin console by selecting Admin from the top navigation bar. Select User Adoption from the side navigation bar.
Alternatively, search for the Liveboard on the Liveboards page.
Use the Liveboard
You can filter the Liveboard by user from the filter bar underneath the Liveboard name.
Use this Liveboard to view and analyze information about the following topics:
-
hourly, daily, weekly, and monthly active users
-
number of user actions on the Liveboards and answers in the cluster
-
which users are most active in ThoughtSpot, and what they do
-
popular Liveboards
-
user actions in the last month
-
unused answers and Liveboards
-
inactive users
-
users by last login, number of Liveboard interactions, number of Search interactions, and number of days logged in during the last 6 months
Best practices
The User Adoption Liveboard contains valuable information you can use to monitor and manage user consumption of the ThoughtSpot product. Follow these best practices when interacting with this Liveboard:
-
Share the User Adoption Liveboard with other ThoughtSpot champions and executive buyers in your organization. To share the Liveboard, you must search for the Liveboard from the Liveboards page. You can’t share it from the Admin Console.
-
Consider creating a dedicated group for your data leaders or champions, so you can easily share insights, such as this Liveboard, that help your teams drive adoption.
-
-
Spot usage trends, such as the number of users, the amount of activity, and the number and types of objects accessed over time. Use the Weekly Active Users, Daily Active Users, Hourly Active Users, and Popular Pinboards Last 30 Days visualizations.
-
Understand which actions in ThoughtSpot are most popular, using the User Actions Last 4 Weeks, Weekly User Action Group Ratio, and Weekly User Action Group visualizations.
-
Object management: view the Abandoned Answers and Abandoned Pinboards visualizations, and clean up unnecessary or unused objects.


