System cluster Liveboard
You can view cluster information from the Admin Console. The System Cluster Liveboard contains several ThoughtSpot answers that display capacity, latency over time, snapshot status, installed release, node functions, and logs. To view this Liveboard, navigate to the Admin Console by clicking on the Admin tab from the top navigation bar. Select Cluster from the side navigation bar that appears.
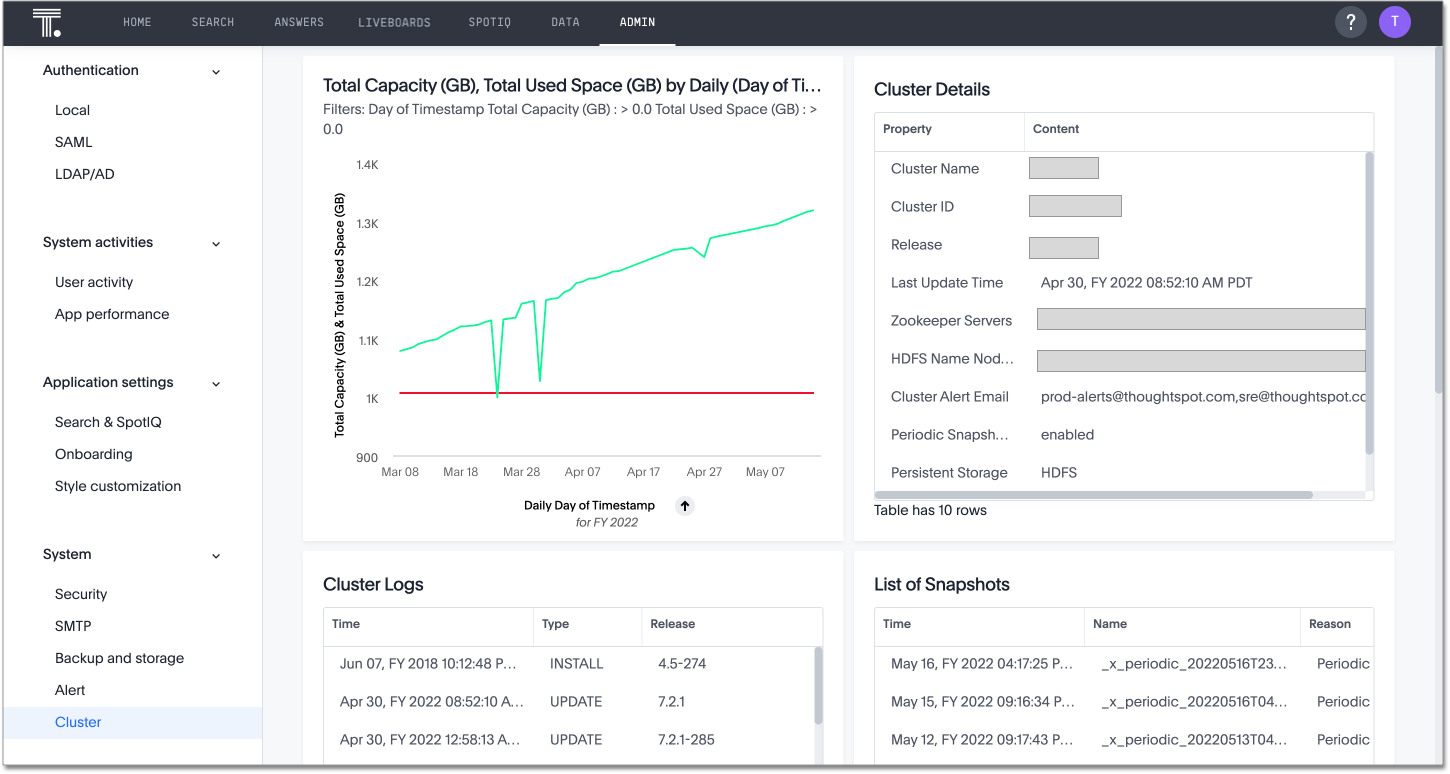
Only the Average Latency Last 2 Weeks (sec) and Total Capacity panels contain a standard ThoughtSpot visualization. The other visualizations rely on internal queries that aren’t accessible. You can, however, Present them.
Total Capacity (GB), Total Used Space (GB) by Daily (Day of Timestamp)
The Total Capacity (GB), Total Used Space (GB) by Daily (Day of Timestamp) chart displays your cluster’s total capacity and estimated used capacity over time.
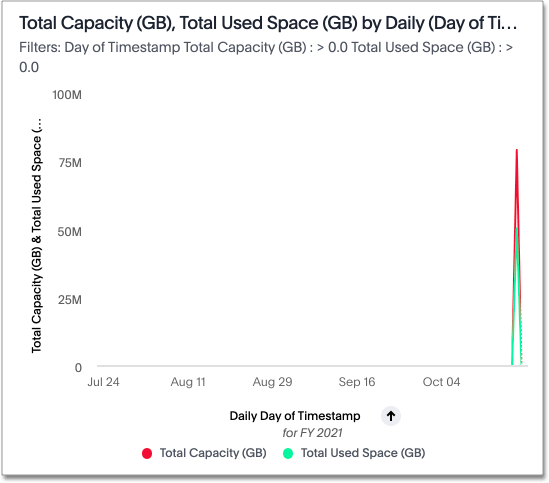
The x-axis is by time and the y-axis measures the size in GB. You can zoom in and see daily or hourly utilization data. So, in the Space Utilization chart, the green line shows the amount of capacity in use in the system, while the red line shows the total capacity. An increase in the red line at the end of a time period indicates the addition of extra hardware, resulting in increased capacity.
The query for this answer is the following:
day of timestamp
total capacity (gb)
total used space (gb)
daily
last 90 days last 25 hours
total capacity (gb) > 0
total used space (gb) > 0
The chart relies on the TS: Internal Table Wise Capacity WS worksheet.
It tracks total used space, which consists of raw uncompressed data, including replication.
Cluster Details
The fields on this visualization have the following meaning:
- Cluster Name
-
The name of the cluster defined at installation time.
- Cluster ID
-
The ID of the cluster set at installation time.
- Last Update Time
-
Last time the cluster was updated.
- Release
-
Version of the current release.
- Zookeeper Servers
-
IP addresses of the Zookeeper servers.
- HDFS Name Nodes
-
Control nodes for Hadoop Distributed File System (HDFS).
Cluster Logs
The fields on this visualization have the following meaning:
- Time
-
A timestamp indicating when an action occurred.
- Type
-
Type of action.
- Release
-
Identifies the full release number.
You can also use the tscli logs command to review log data from your cluster.
List of Snapshots
This visualization shows the snapshots and the backups taken on the cluster. The fields on this visualization have the following meaning:
- Time
-
A timestamp indicating when a snapshot or backup happened occurred.
- Name
-
Name of the snapshot file. These files are stored in the
/usr/local/scaligent/backupdirectory on your cluster. - Reason
-
Identifies the reason the snapshot/backup was created. You should see several period snapshots if your cluster is configured properly. You may also see evidence here of manual backups. For example, you should be sure your cluster is backed up before major events such as upgrades. Contact ThoughtSpot support if you don’t see evidence your cluster is periodically creating snapshots.
- Size
-
Size of the backup in gigabytes.
Average Latency Last 2 Weeks (sec)
This visualization relies on the TS: BI Server worksheet to display the average database latency over the last 15 days.
The database latency measures how long it takes for a search to return data from ThoughtSpot - this doesn’t include the time taken to send the answer back to the client, it measures internal processing time.
You can use the visualization menu to drill down to its underlying query:
average datacache (sec)
average total (sec)
daily
last 15 days
for database latency (us) > 0


