Set chart and table visualization fonts
Learn how to add and edit fonts to customize ThoughtSpot’s appearance.
You can add and edit fonts to customize the appearance of your charts and tables. Be careful though, since the interface may become unreadable depending on how you change the default font, font weight, or font style. It is therefore suggested that you use the default font settings.
If you are confident in your knowledge of font visualizations, you can set your chart and table visualization fonts by following these steps:
-
If you are on release 6.2.1 and later, navigate to the Admin Console by clicking on the Admin tab from the top navigation bar. Select Style Customization from the side navigation bar that appears. To enable style customization on release 6.2.1 or later, you must add
?customBrandingEnabled=trueto the end of your URL.If you are on release 6.2, navigate to the Style Customization page using this URL, replacing
<cluster_IP>with your cluster information:https://<cluster_IP>/#/admin/settings/style-customization.If you are on release 6.1.1 or earlier, navigate to the Style Customization page by selecting Admin from the top navigation bar, then clicking Style Customization.
If this page is not available, contact ThoughtSpot Support to enable style customization.
-
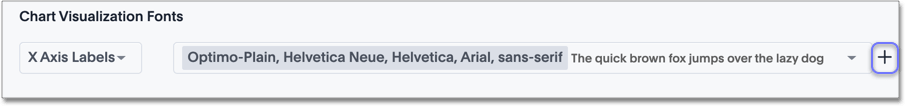
Click the Add New button under Chart Visualization Fonts.
-
In the add new font menu, select the details for the font:
-
Upload your custom font.
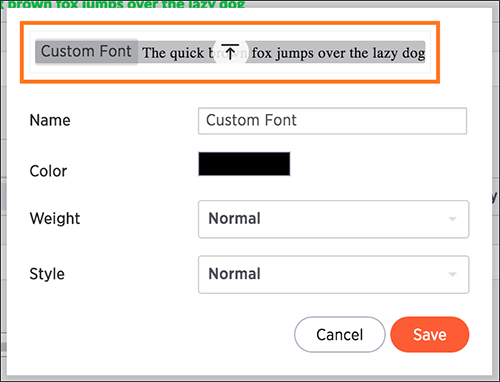
Only WOFF font types are supported.
-
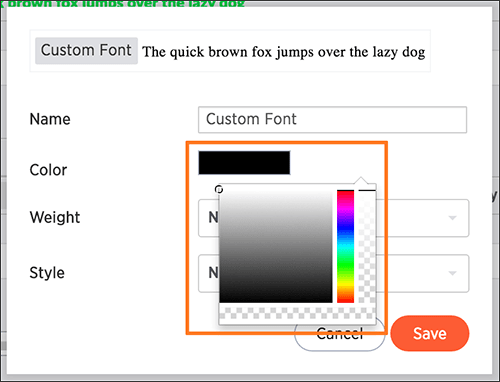
Use the color menu to choose the font color.
-
Choose the font weight and style from the drop down menus.
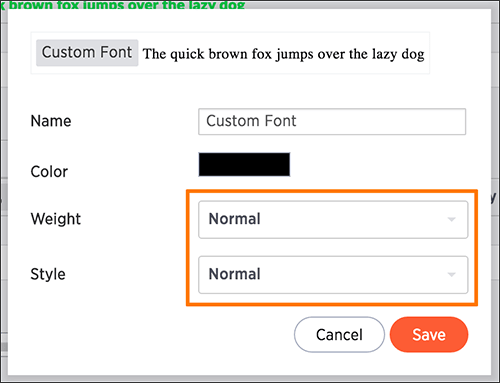
The font weight choices are normal, bold, and light. The style choices are normal, italic, and oblique.
-
Click Save.
-
-
Click the Edit Font icon
 to make changes to the font you just uploaded or to a pre-existing font.
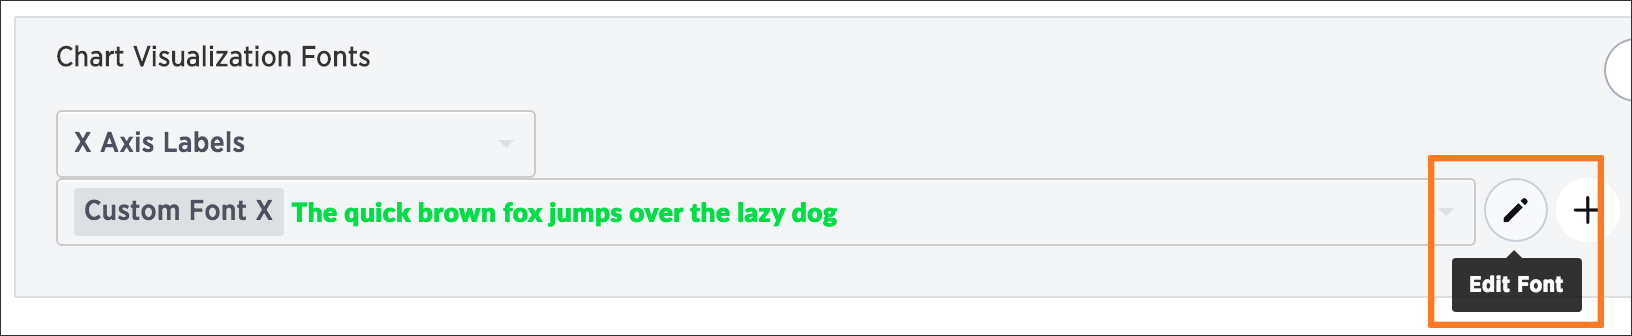
-
Make any changes to the details of the font in the edit menu and click Save.
-
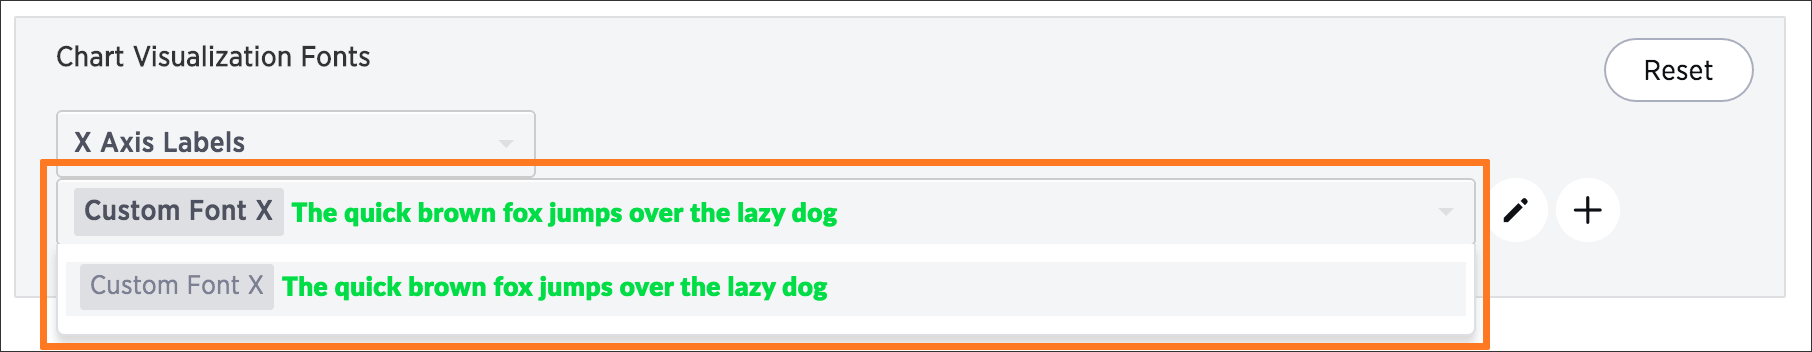
Click the custom font drop down to choose your custom font.
-
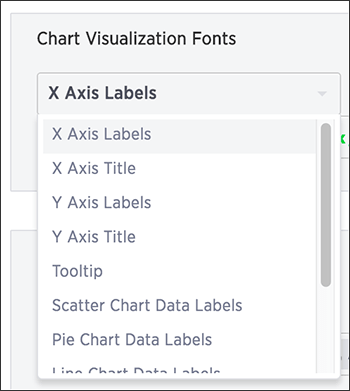
Click the chart label drop down to choose where you would like to apply your custom font.
-
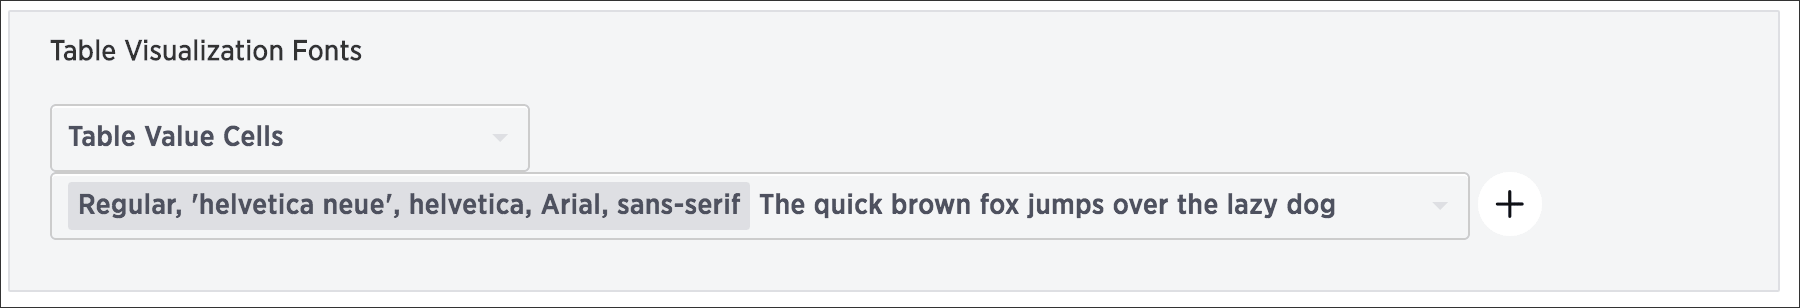
The same steps can be followed to set your Table Visualization Fonts.
-
Click the Reset button on the upper right hand side of the sections if you would like to bring back the default fonts.
Related information


