Custom SpotIQ analysis
Learn how to customize SpotIQ analysis.
Everywhere in ThoughtSpot where you can run SpotIQ analyze, you can configure a customized SpotIQ analysis. The customized analysis can be a one-time customization or can apply to all future analysis of that particular data source.
Finding customization controls
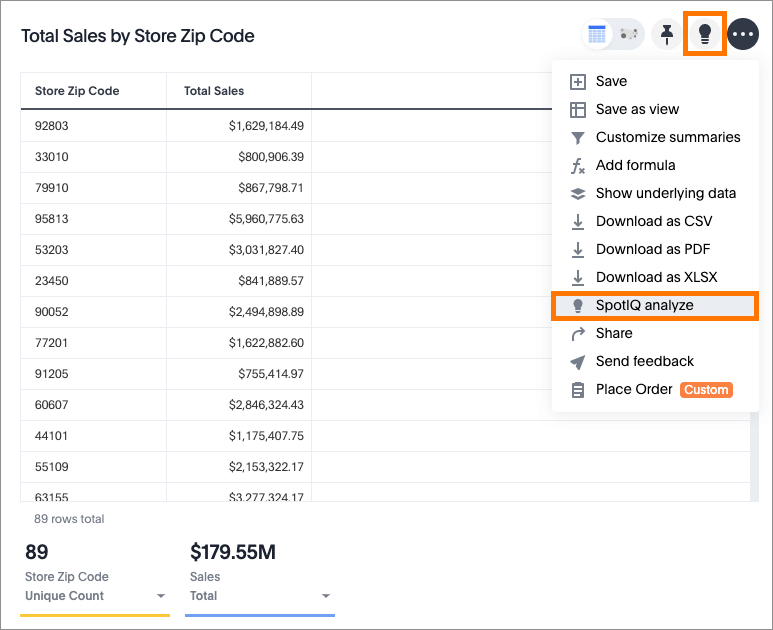
Every menu or location where you can run SpotIQ analyze, you can customize your analysis.
You access it using the lightbulb button ![]() or the More menu
or the More menu ![]() .
.
Regardless of where you run SpotIQ analyze in ThoughtSpot, the SpotIQ window has the same layout. The columns displayed, though, are specific to the data from which you run SpotIQ analyze.
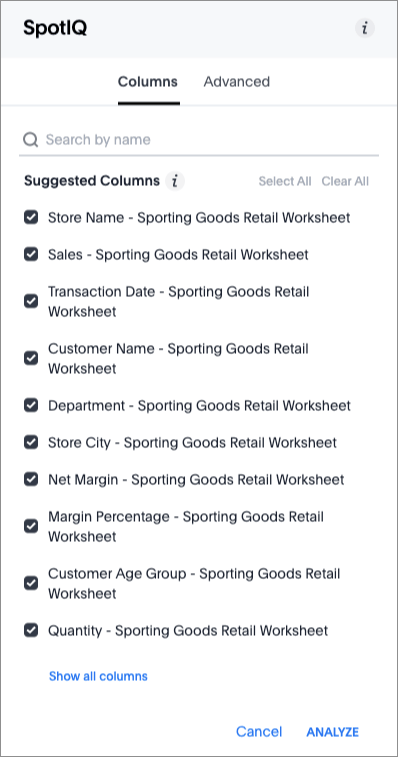
This window has two tabs:
-
Columns, where you can explicitly indicate which columns to include in a SpotIQ analysis. (You can select all, some, or none.)
-
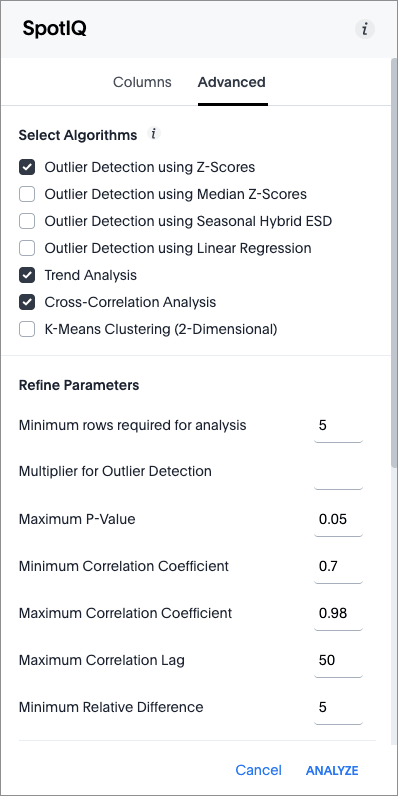
Advanced, where you can run custom analyses and incorporate R scripts into SpotIQ.
The Advanced tab has many options. The panel scrolls, so more algorithms are available than appear in the following image
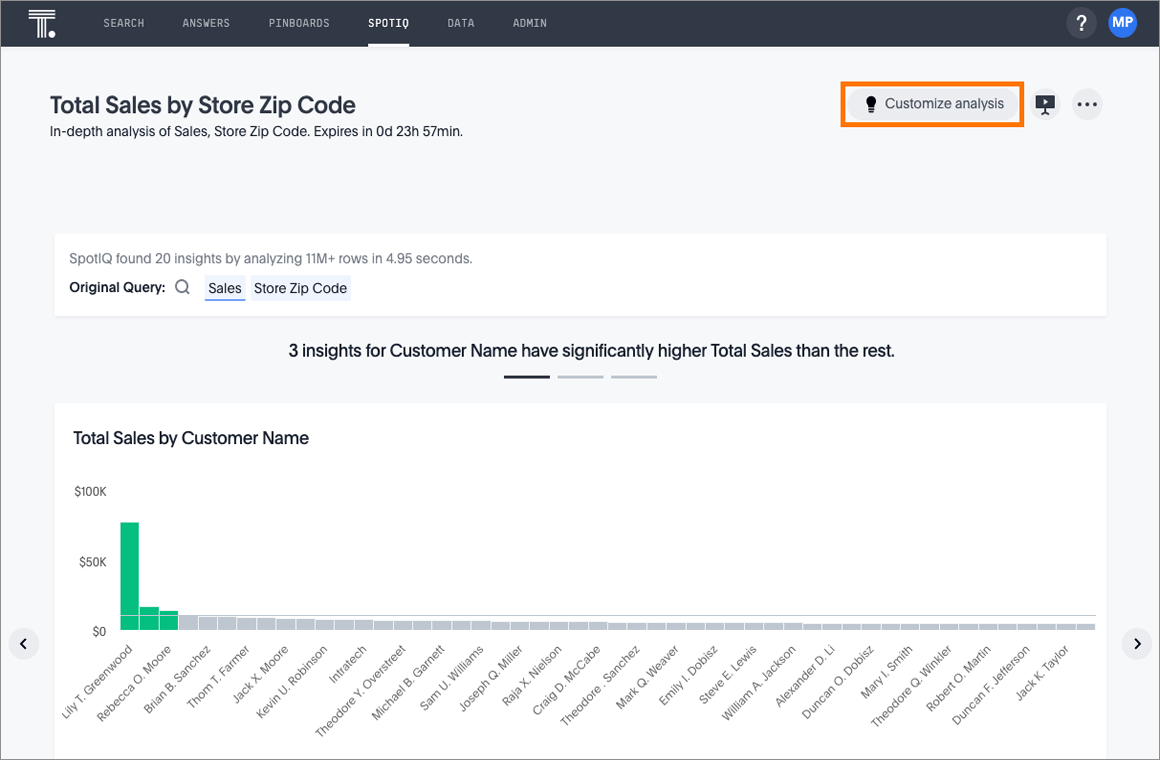
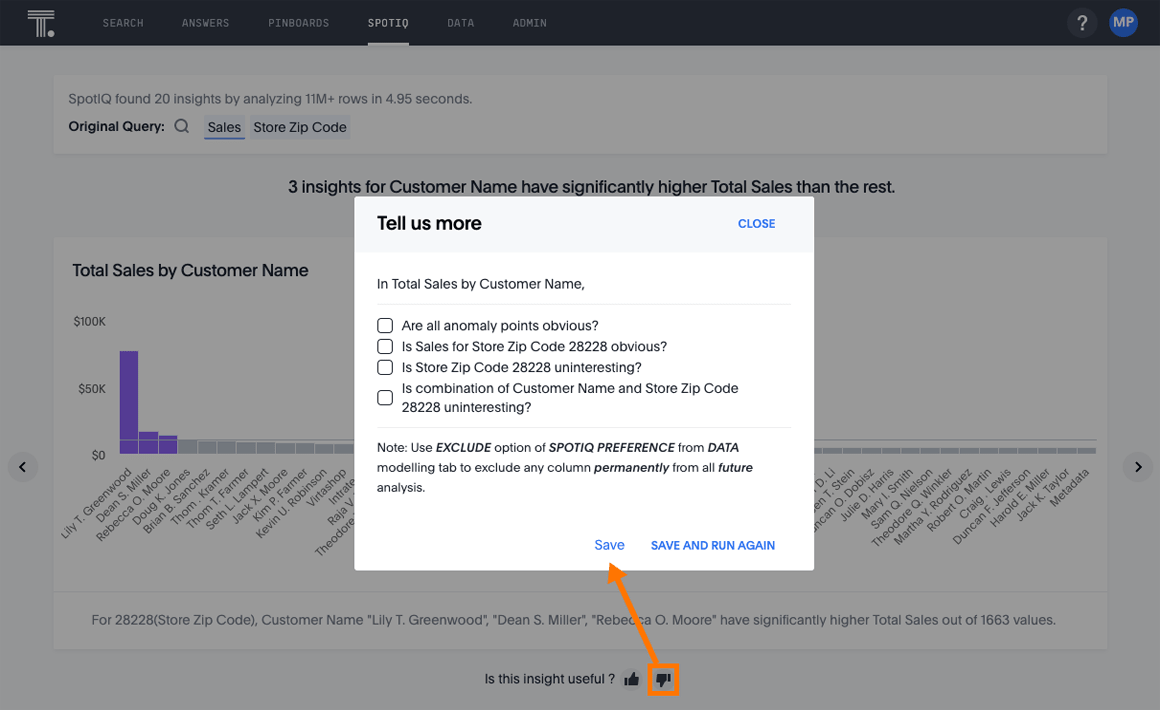
The SpotIQ insights page has an option to open this window to customize a single analysis.
The Tell us more window provides information on how to exclude a value from all future analysis.
You can set SpotIQ customization parameters in your SpotIQ preferences, along with options for email notifications when analyses run.
Eliminate null values
| From next analysis | From future analyses |
|---|---|
In the Search bar, add a filter |
Set Exclude null values from my analysis on your user Profile to exclude them from any future SpotIQ analyses you do. |
Exclude uninteresting column(s) in insight
| From next analysis | From future analyses |
|---|---|
Use the EXCLUDE option of SPOTIQ PREFERENCE under the DATA tab to exclude any column permanently from all future analysis. |
|
Include an interesting column
You can always include columns that interest you in your analysis.
| From next analysis | From future analyses |
|---|---|
Choose Customize analysis and select columns that you want to include. |
Ensure Index Priority is between 8-10 on the column under the DATA tab. |
Remove known date outliers
Your data may contain known outliers. For example, you are in the middle of a quarter and only want to analyze the previous quarter. Anything from the present quarter could contain an outlier.
| From next analysis | From future analyses |
|---|---|
In the Search bar, add a filter |
Not applicable. |
Too few insights
Your SpotIQ analysis may not provide you as many insights as you think it should.
| From next analysis | From future analyses |
|---|---|
Choose Customize analysis, select the Advanced tab, and decrease the Multiplier for Outlier Detection to a value closer to zero. |
Not applicable. |
Explaining Anomaly Insights
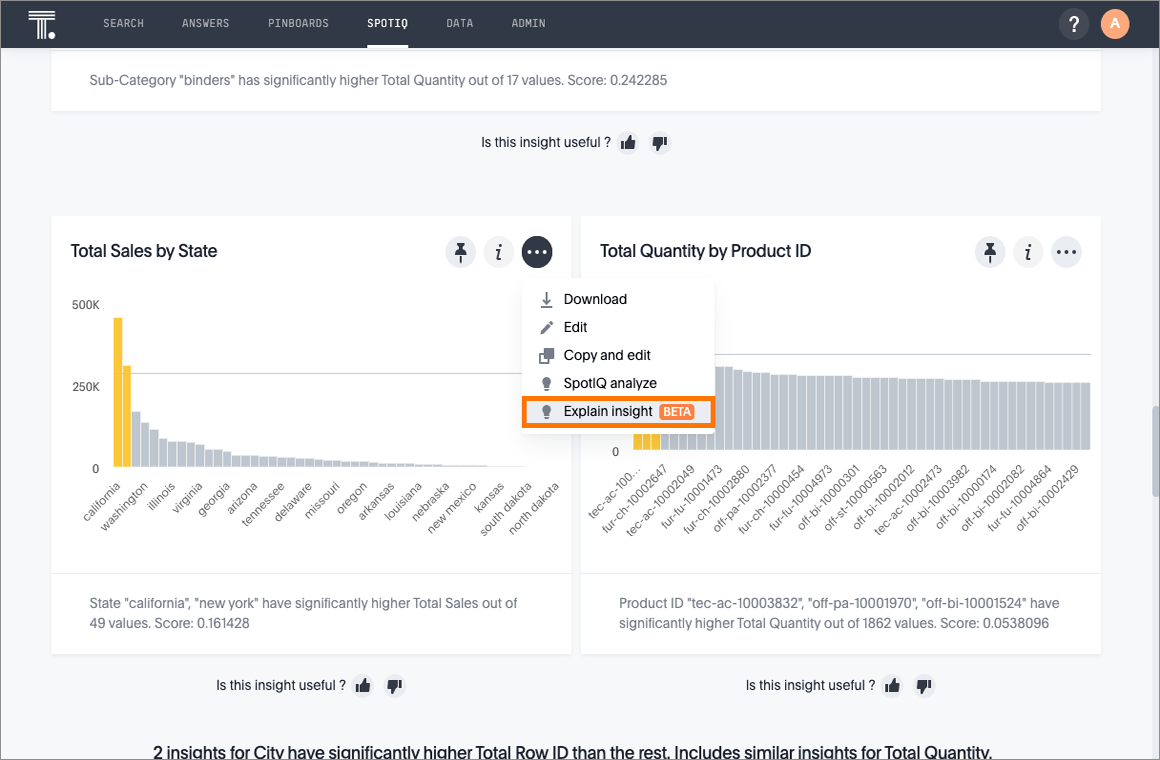
When SpotIQ finds insights with anomaly points, you have the option to run the Explain Insight command to have SpotIQ do further analysis on the anomaly points.
To explain an insight, do the following:
-
Click the More icon
 for the insight you want to explain and select Explain insight.
 -
In the SpotIQ window, click Analyze.
Analysis begins.
-
Click SpotIQ in the top navigation bar.
-
Click the Analyses tab.
-
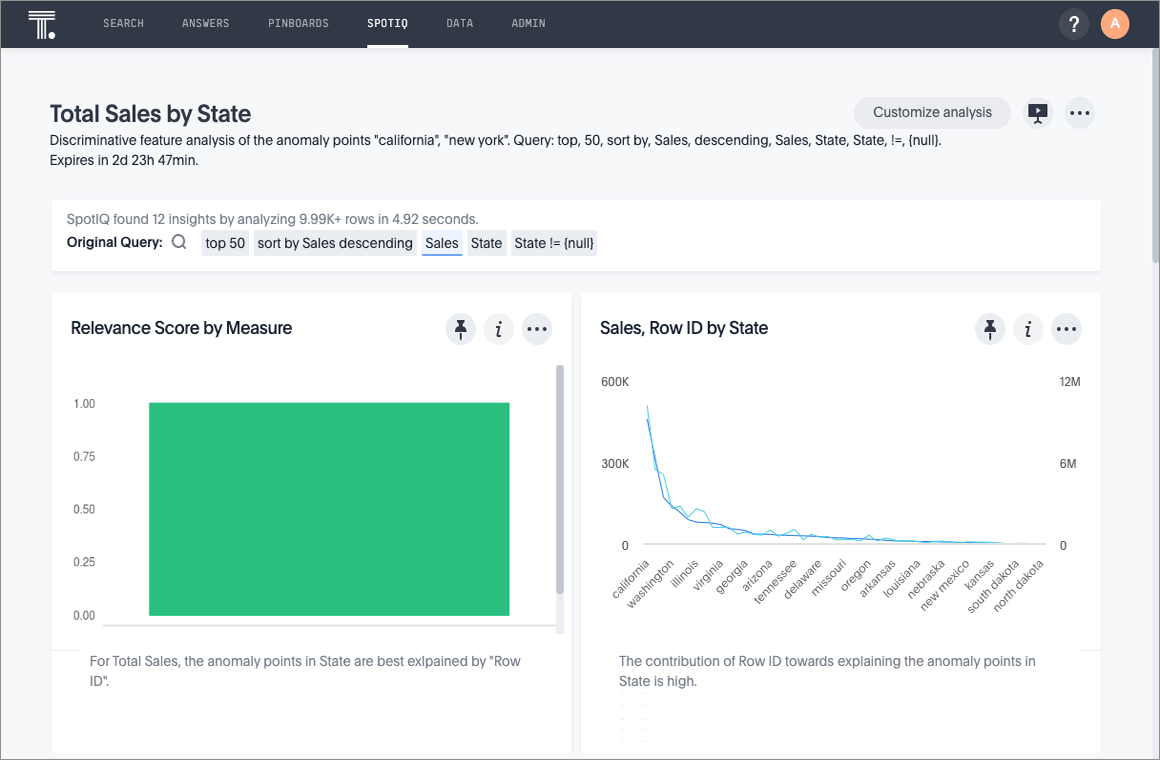
Find the name of the insight that you analyzed and click View Results.
The results of your insight analysis explaining your anomaly points appear.
Explain insight does not work with Trend Analysis or Cross Correlation Analysis.


