Get your configuration and logs
Two main troubleshooting tools are getting a log bundle and understanding your cluster configuration.
For troubleshooting on specific incidents or cluster problems, two things are important: understanding your current configuration and getting a log bundle.
Check your configuration
-
Log in to the ThoughtSpot cluster as the
adminuser. -
Use the
tscli featuresubcommand to display your current configuration.$ tscli feature get-all-config +---------------------------------+----------+---------------+ | NAME | STATUS | CONFIGURATION | +---------------------------------+----------+---------------+ | Firewall | Disabled | | | Saml | Disabled | | | Ldap | Disabled | | | CustomBranding | Disabled | | | CustomBrandingFontCustomization | Disabled | | | DataConnect | Disabled | | | RLS | Enabled | | | Callhome | Enabled | | | SSHTunnel | Enabled | | | Fileserver | Disabled | | +---------------------------------+----------+---------------+
How to get logs
There are two ways to get logs:
-
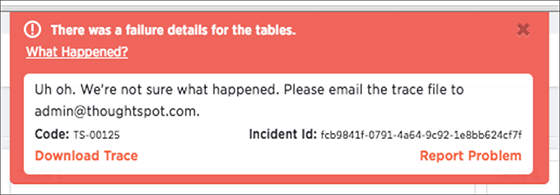
When ThoughtSpot encounters a problem, a red bar displays in the browser with an error message. You can click What Happened? in the error message for more details. To download related logs, click Download Trace. Send the logs as an email attachment to the support contact that is provided. Clicking Report Problem will also send the logs as an email attachment to your administrator.

-
You can generate a log bundle using the
tsclicommandtscli logs collectif you are comfortable with Linux. The command lets you specify which logs to collect and from what time periods.Usage for this command is:
  tscli logs collect
    --include <selector | glob>
    [--exclude <selector | glob>]
    [--since <hours,minutes,days>
    | --from <yyyymmdd-HH:MM>
    --to <yyyymmdd-HH:MM>]
    [--out <path>]
    [--maxsize <size_in_MB_or_GB>]
    [--sizeonly]
The full list of all selectors is:
-
allcollects all of the logs listed from the system and the ThoughtSpot application. -
systemcollects all system logs, e.g. syslog, upstart, mail logs, etc. -
tscollects all logs from the ThoughtSpot application. This includes falcon, sage, orion core (cluster management), etc. -
orioncollects all orion logs including cluster management, hdfs, zookeeper, etc. Detailed syntax and options are listed in the tscli command reference.
-
Examples
Here are some examples of usage for the command tscli logs collect:
To collect all logs from the past day to the default location (/tmp/logs.tar.gz):
$ tscli logs collect --include all --since 1d
In this example, all is a selector for all the available logs.
In most cases, you can probably use the selector ts to only capture logs for the ThoughtSpot application:
$ tscli logs collect --include ts --since 2d
For debugging cluster management issues, use a command like this one, which collects logs for system and orion from the past 2 hours.
The output is written to /tmp/debug.tar.gz as specified using --out:
$ tscli logs collect --include system,orion --since 2h --out /tmp/debug.tar.gz
This command collects logs from a specific time window:
$ tscli logs collect --include system,orion --from 20150520-12:00 --to 20150522-12:30
Advanced usage alert!
You can also use --include and --exclude to specify filesystem paths as a glob pattern.
This works like the Linux find(1) command.
Pass all the entries in --include starting with / to find(1), and all entries in --exclude which are not selectors to find(1) using the -not -path flag.
$ tscli logs collect --include system,orion --exclude *hadoop*,*zookeeper* --since 2h
The above command collects all system and all orion logs, but excludes hadoop (hdfs) and zookeeper logs. See Upload logs to ThoughtSpot Support about using a secure file sever to collect log files or other files needed for troubleshooting. You can easily send log files to this file serve directly from the ThoughtSpot instance.
Related information


