Filtered aggregation functions
You can create a filtered aggregation in the search bar.
Filters are useful for queries where the results should reflect a new, filtered value. On this page you learn about comparative versus derivative filters, and the functions, and the keywords that you can use with them.
Comparative and derivative filters
Comparative filters compare two segments of some whole against each in the Search bar. For example, a company that has locations across the United States, may want to compare total revenue in the West to the East segment. In a comparative filter, one of the segments you are comparing is filtered.
An example of a comparative filter is comparing west revenue with total revenue.
In these cases, one measure is a filtered measure, for example, revenue region = west is a filtered measure.
Derivative filters add a column to your results which is derived from other columns in the same results. For example, you search for revenue and cost and want to calculate profit in your result.
Some examples of comparative and derivative filters in the real world are:
-
revenue of this_soap versus all_soaps (Comparative filter)
-
tax as a percentage of revenue (derivative)
-
count revenue as a percentage of state revenue (comparative with a derivative)
If you plan to create these types of filters, you need to understand how to create filter functions.
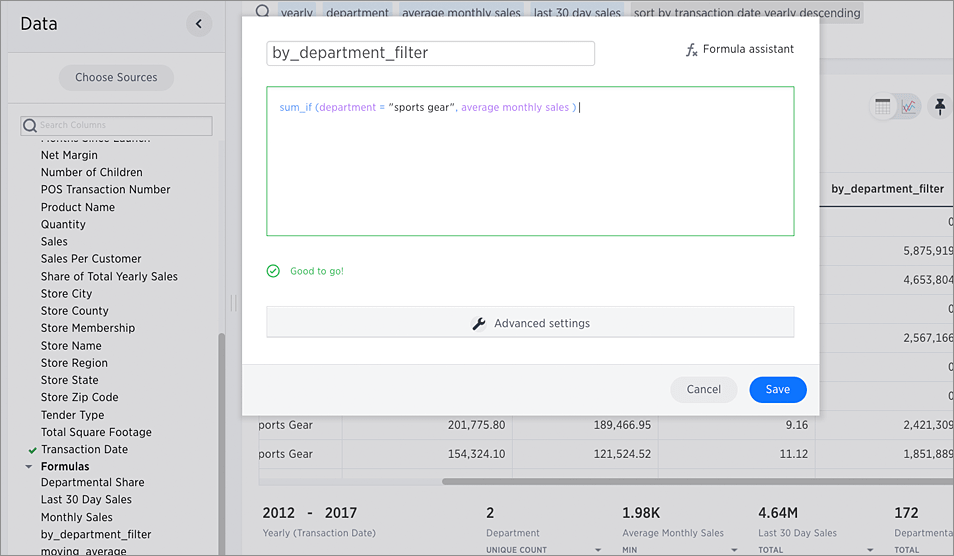
Use filter functions
Filter functions take two arguments, the column ( measure or attribute) to aggregate and the filter condition:
FUNCTION_NAME(condition, <column name>)
ThoughtSpot functional library will include the following functions:
-
sum_if -
average_if -
count_if -
unique_count_if -
max_if -
min_if -
stddev_if -
variance_if -
vs -
all
The following table illustrates some examples of these functions in use:
| Function | Examples |
|---|---|
|
Takes a measure and one or more attributes. Returns the average of the measure grouped by the attribute(s). group_average (revenue, customer region) |
|
Takes a measure and one or more attributes. Returns the count of the measure grouped by the attribute(s). group_count (revenue, customer region) |
|
Takes a measure and one or more attributes. Returns the count of the measure grouped by the attribute(s). group_count (revenue, customer region) |
A condition can have multiple filters like sales region = west OR region = east.
You can also just type a value such as east as in sales east as a filter.
If there are no rows matching the criteria, the condition returns a 0 (zero).
A 0 can result in situations where there are logic errors in the formula, so be sure to double-check your work.
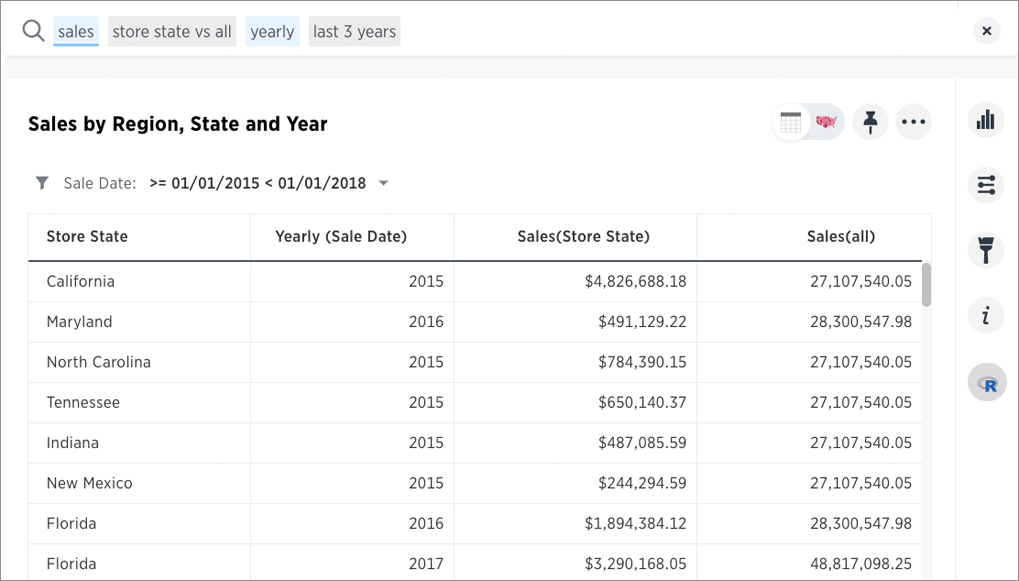
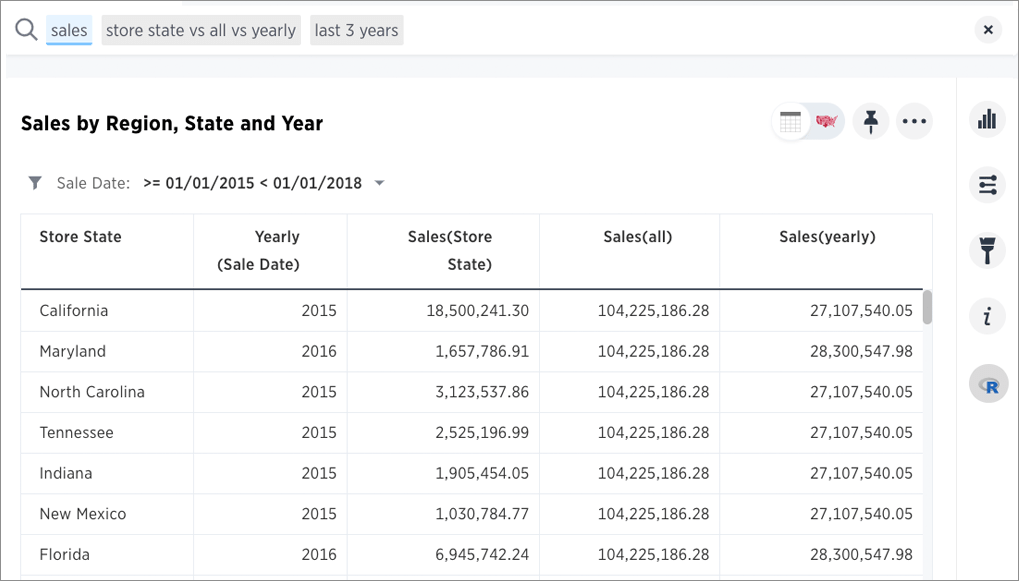
After you have aggregated with a filter, you can do further comparisons with the vs and all keywords.
Using the vs and all keywords
You can use the vs and all keywords to expand the usefulness of your comparison filters.
It compares a measure across different sets of filters and or groupings.
The basic format of a comparison search is:
<common search tokens> (A vs B) <common search tokens>
For example:
revenue region last 10 years vs all
Try this syntax on using the Superstore example data.
The first vs example compares two segments with a single search token:
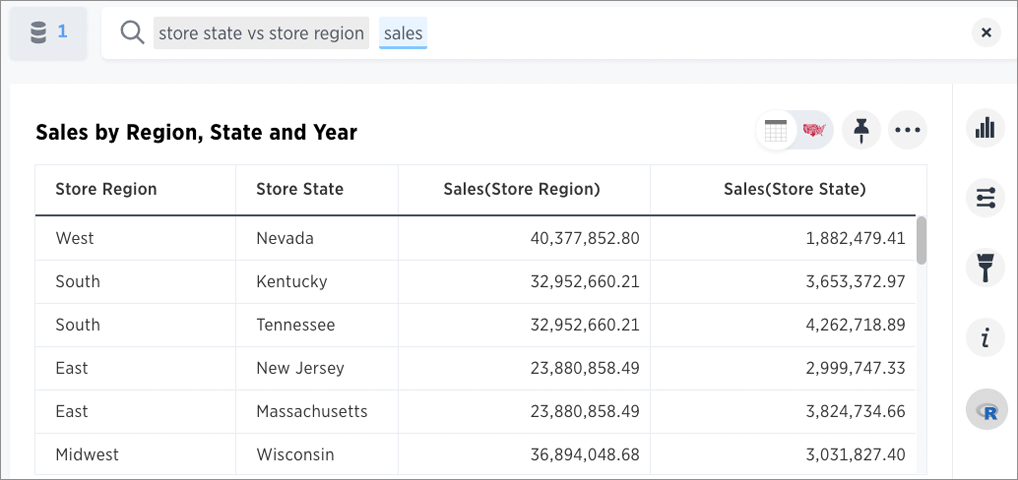
The system automatically applies the sales token to both sides and groups each segment.
You can use the all keyword to break out the segments and avoid grouping.
You can also provide multiple vs instances:
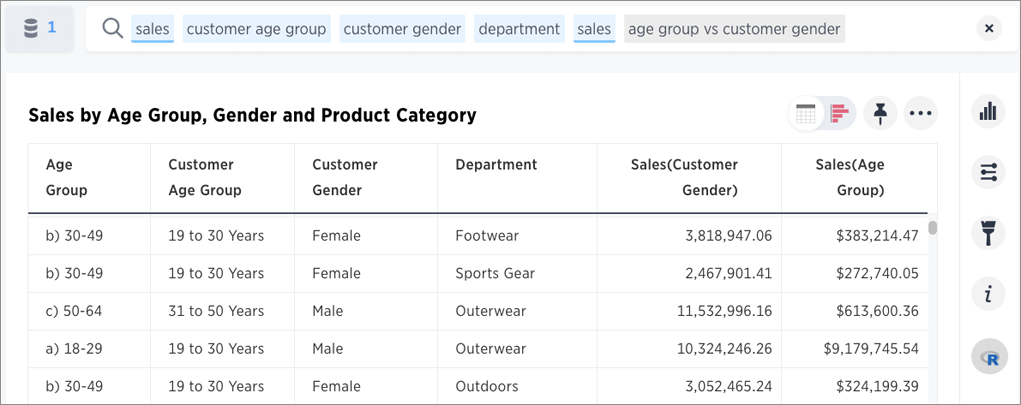
Of course, you can compare across different columns as well:
Other supported formats you can try:
-
sales accessory6 accessory12 vs all -
sales monthly accessory6 vs last year -
sales staples file caddy vs all monthlyanswers what the share of sales belonging to the file caddy by month -
sales (germany ariel vs laundry) july 2017 timeanswers what is the category share of Germany Ariel for July 17?


