Add regression lines
To add a regression line, you need a search with only one attribute and one measure. Otherwise, this option is greyed out in the settings panel. As soon as you modify the search to contain a single measure and attribute, the regression line option is clickable.
-
While viewing your answer as a chart, click the chart configuration icon
 on the top right.
 -
Click Settings at the bottom of the Customize menu.
-
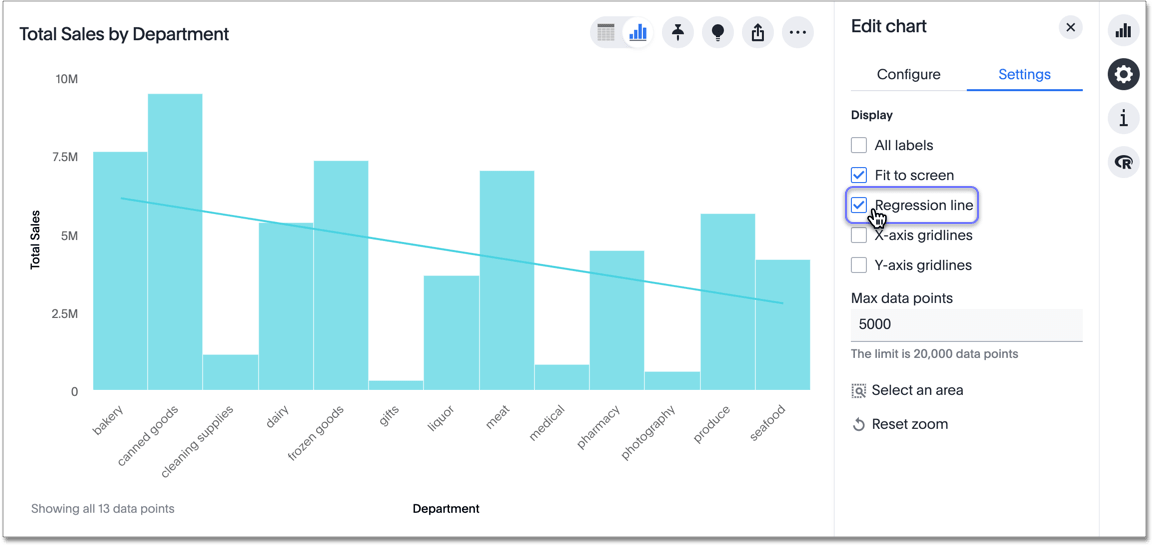
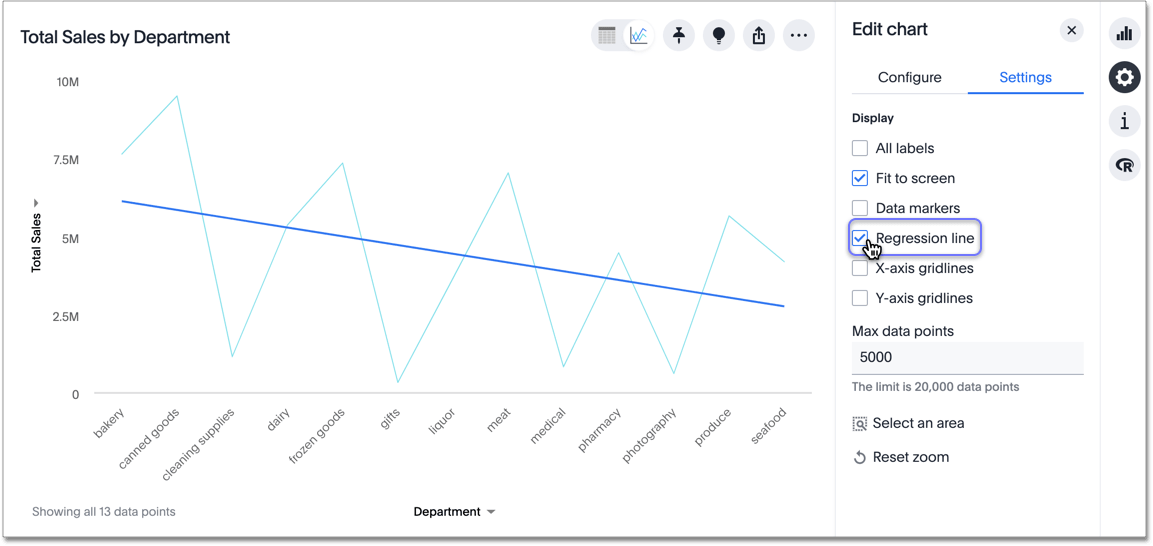
Select Regression line.
You can show regression lines on most types of charts (bar, stacked bar, line, bubble, and so on).
In the following examples, sales is the measure and department is the attribute.
Was this page helpful?Give us feedback!


