System pinboards
ThoughtSpot provides several pinboards that help with system monitoring.
There are several system monitoring pinboards in ThoughtSpot that provide answers for system status and resource usage questions. The information in these pinboards are updated hourly from internal data sources that collect monitoring statistics.
Only users with administrative privilege can view the monitoring pinboards. They are based on worksheets, which administrators can view, but not modify. However, you can create new monitoring pinboards from the worksheets.
List system pinboards
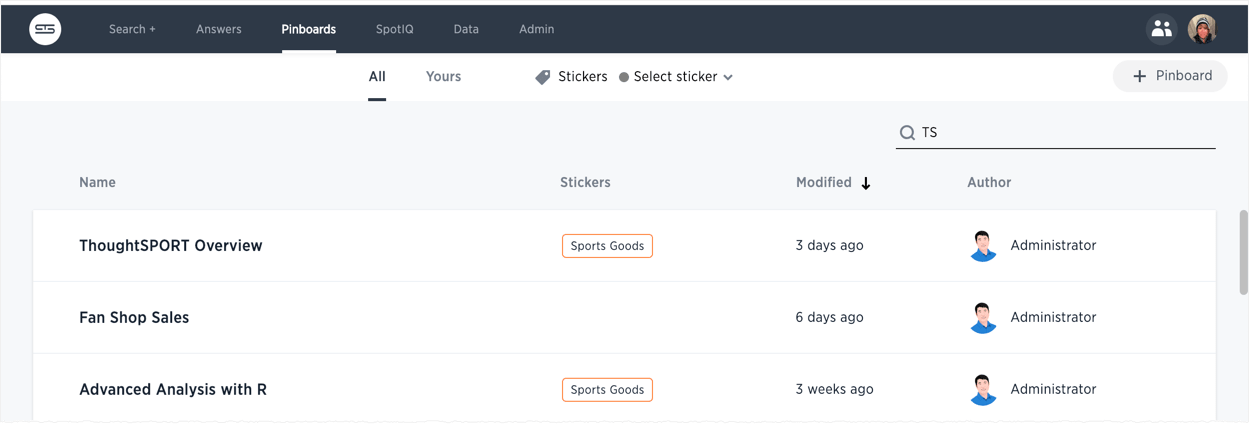
To list these system pinboards:
-
Go to the Pinboards tab.
-
Choose All.
-
Enter `TS: ` in the search field.
Summary of system pinboards
| Pinboard | Description |
|---|---|
Learn how to use ThoughtSpot |
Contains search replays created in the system. |
TS Stats: Alert Detail |
Combines alerts, notification events, and configuration events boards. |
TS Stats: Cluster Detail |
Contains cluster details, logs, snapshots, and latency data. |
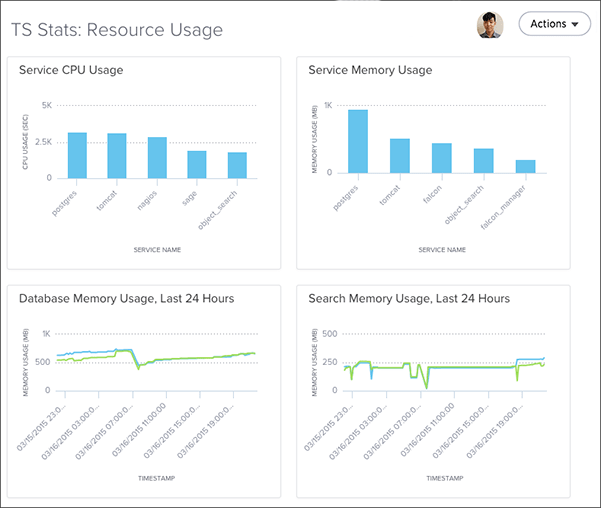
TS Stats: System Information and Usage |
Replicates the page. |
TS Stats: Latency Visualizations |
Latency on servers and impression counts. This data comes from the TS: BI Server worksheet. |
TS Stats: Table Status |
Replicates the Data board. |
About deprecated boards
The deprecated boards (TS status: Usage - Deprecated and TS StaTS: Queries — Deprecated) are there to support older installations.
New installations should not use or rely on deprecated boards.
Older installations that have used these boards in some way should use the new boards and remove any dependencies.


