Create and use Worksheets
| Worksheet creation is deprecated starting in the 10.4.0.cl release, and is disabled by default. If you need to create a Worksheet and the option is not available to you in ThoughtSpot, contact your ThoughtSpot administrator to enable Worksheet creation. |
ThoughtSpot uses Worksheets, which are logical views of data, to model complex datasets. The Worksheets simplify access to data for end-users and application services by incorporating these key features, and more:
-
Table joins supplement the primary data with information from various other data sources.
-
Changing data types ensures that you can handle mismatches gracefully, For example, conversions of date/time type formats, and processing of numeric codes (such as event IDs) correctly.
-
Derived fields support flexible expressions and formulas.
-
Renamed fields make charts and tables easily accessible.
-
Selecting fields allows you to focus only on the fields that are necessary to the business use case.
-
Hiding fields lets you change the visibility of data by obscuring and securing sensitive information without affecting the calculations that depend on it.
If a hidden column is used in an Answer pinned to a Liveboard, then the entire Liveboard becomes read-only to users. This limits Liveboard functionality, which means the ability to adjust filters and download data is restricted. -
Changing the default aggregation of fields in a Worksheet prevents common mistakes when building visuals.
After modeling your data, create Worksheets to make searching easier. For example, a sales executive might need to search for information about retail sales. This data might be contained in several tables (sales, customers, products, stores, etc.), with foreign key relationships between them. An administrator who is familiar with the data model can create a retail sales Worksheet, that combines all of the related fact and dimension tables into a single, easy-to-use view, and share it with the sales executive. This provides access to the data without requiring an understanding of how it is structured.
Guidelines for Worksheets
Users are often unfamiliar with tables and how they are related to one another. A Worksheet groups multiple related tables together in a logical way. You might use a Worksheet for these reasons:
-
To pre-join multiple tables together.
-
To give a user or group access to only part of the underlying data.
-
To include a derived column using a formula.
-
To rename columns to make the data easier to search.
-
To build in a specific filter or aggregation.
-
To give users a filtered set of data to search.
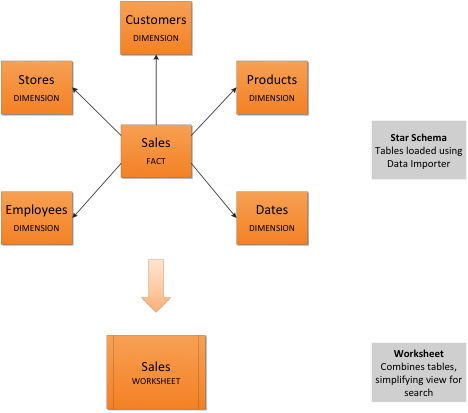
Typically, you create one Worksheet for each set of fact and dimension tables. For example, you may have a sales fact table and an inventory fact table. Each of these fact tables shares common dimensions like date, region, and store. In this scenario, you would create two Worksheets: sales and inventory. The following diagram depicts the workflow for creating the sales Worksheet.

The process for creating a Worksheet is:
-
Decide which tables to use for the Worksheet.
-
Create a new Worksheet. If the Worksheet already exists in another cluster, you can migrate it using a flat
yamlfile. -
Add sources (tables) to the Worksheet.
-
Choose the Worksheet join rule.
-
Select the columns to include.
-
Optionally modify the join types within the Worksheet.
-
Optionally create formulas.
-
Optionally create Worksheet filters.
-
Save the Worksheet.
-
Model the Worksheet for search: rename columns, add descriptions, and set aggregation types. See Overview of data modeling settings.
Create a Worksheet
To create a new Worksheet:
-
Select Data, on the top navigation bar.
-
Select the + Create new button in the side navigation bar.
-
Select Worksheet.
Add sources and columns to a Worksheet
After creating a Worksheet, you need to add the sources that contain the data. A source is another name for a table. The sources you choose are typically related to one another by foreign keys.
To add sources to your Worksheet, follow these steps. The Worksheet creation UI also guides you through the process.
-
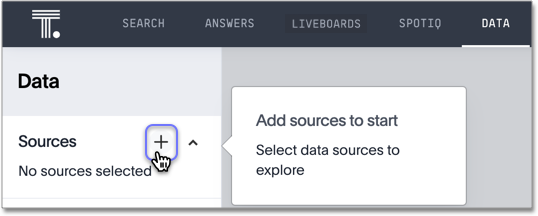
Select the + icon next to Sources.

-
Select the checkbox next to each of the sources you want to include in the Worksheet. You can search for specific Views or tables. You can also select every data source that has a specific tag, like Retail.
Note that the list of sources only shows the data sources on which you have view or edit privileges.

-
Choose the Worksheet join rule. Either apply joins progressively or apply all joins. Applying joins progressively speeds up performance.
-
If you want to disable row-level security for this Worksheet, select the checkbox to disable it.
-
Select CLOSE to save your changes.
-
Expand the table names under Sources and select the columns to add to the Worksheet, by doing any of the following:
-
To add all of the columns from a table, click the table name and select + Add Columns.
-
To add a single column, double-click its name.
-
To add multiple columns, Control + click each column you want to add and select + Add Columns.
Note that after you add a column, non-related tables (those without a primary/foreign key relationship) become hidden. If you are working with two tables that should be related, but are not, you can add a relationship between them.
-
-
(Optional) Modify the join types within the Worksheet.
-
(Optional) Create formulas.
-
(Optional) Create Worksheet filters.
-
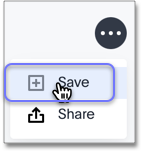
Select the more options icon
 , and select Save.
 -
In the Save Worksheet window, enter a name and description for your Worksheet and select SAVE.
-
(Optional) Select each column name and enter a more user-friendly name for searching. You can tab through the list of columns to rename them quickly. ThoughtSpot automatically optimizes column names to make searching easier. When you add a column to a Worksheet, ThoughtSpot automatically converts it to title case, and replaces any underscores with spaces. For example,
customer_ageautomatically becomesCustomer Age. -
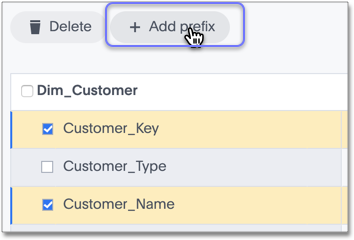
(Optional) If you want to add a prefix to the name of several columns, select them, click the Add prefix button, and type in the prefix.

-
Select the more options icon
 , and select Save.
-
The Worksheet details page appears. Review your Worksheet, and make any additional changes you would like. Note that if any of your columns contain aggregate formulas, or if your Worksheet contains a chasm or fan trap, ThoughtSpot does not show data samples.
-
Share your Worksheet, if you want other people to be able to use it.
Role-playing dimensions
A role-playing dimension is when a single physical dimension is referenced multiple times in a fact table, with each reference linking to a logically distinct role for the dimension. ThoughtSpot supports role-playing dimensions, or multiple join paths, for Worksheets. For example, you may have a fact table joined to a dimension table more than once. This is useful for cases such as when you have a sales fact table and an employee dimension table, where the sales table may record the employee ID who created, updated, and owned a record. In this case, you would want to join these three columns to the employee dimension table on employee ID.
When adding attribute columns from that dimension table to your Worksheet, ThoughtSpot prompts you to choose which join path you would like to use for that column. To use role-playing dimensions, select that attribute again, modify the name, and choose the other join path when ThoughtSpot prompts you to select one. For more information, see Model role-playing dimensions.
Where to go next
-
How the Worksheet join rule works
Use the Worksheet join rule to specify when to apply joins when a search is done on a Worksheet. You can either apply joins progressively, as each search term is added (recommended), or apply all joins to every search.
Related information


Show content