Anomaly detection
You can now see anomalies in ThoughtSpot visualizations. Our new anomaly detection algorithm detects data which does not fall within the expected confidence intervals, while allowing for seasonal changes, variability, and growth over time. For now, this feature is only available in time-series KPI charts. When enabled, the anomaly detection feature projects a range of expected values, or anomaly bounds, for the most recent data points, based on the past trends of your KPI. Any value that does not fall within the expected range is highlighted as an anomaly.
Once the feature is enabled for your cluster, navigate to your profile and scroll to the Experience section. To enable KPI anomalies, click Edit and set KPI anomalies to Show.
Anomaly detection algorithm
In order to detect anomalies, your time-series KPI chart should have at least five data points in the time-series sparkline. For visualizations with 5 to 30 data points, ThoughtSpot shows anomalies based on a moving median algorithm. For visualizations with more than 30 data points, ThoughtSpot uses an open-source machine learning algorithm for anomaly detection. ThoughtSpot uses 80% of the past data points for model training, which then predicts the expected bounds for anomaly detection for the remaining 20% of the data points.
Customize anomaly detection
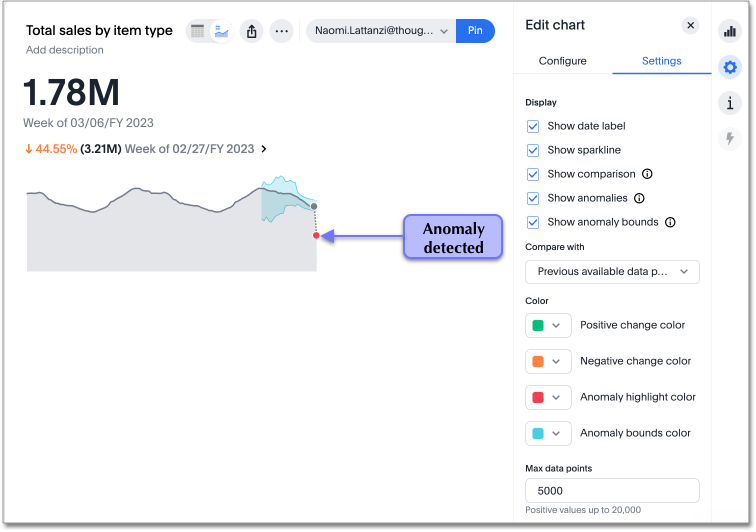
You can change the color of anomaly detection bounds, and the highlight color of detected anomalies. To customize the appearance of the anomaly detection feature, follow these steps:
-
Open a saved KPI answer, or create a new KPI from the Search data page.
-
Select the chart configuration icon from the sidebar to the right of your KPI. Note that anomaly detection will only appear for KPI charts with sparkline visualizations.
-
By default, Show anomalies is selected. You can choose to hide anomaly bounds, and you will still see anomalies highlighted.
-
You can edit the Anomaly highlight color and Anomaly bounds color to make them stand out against your sparkline visualization. Choose a new color by selecting it from the color palette, or by entering a hexadecimal code in the color picker. The chart automatically updates to display your changes.
Limitations
The anomaly detection feature needs at least five data points to analyze in order to function. Data sets with less than five data points will not display anomalies.
In order to provide good anomaly detection, you need to provide at least two cycles of a required seasonality. For example, if you are visualizing data at monthly granularity, to capture yearly seasonality the system needs at least the past 24 months of data.