Show data labels
You can show data labels for every measure in your chart, or configure labels separately for each measure.
Configure all data labels
-
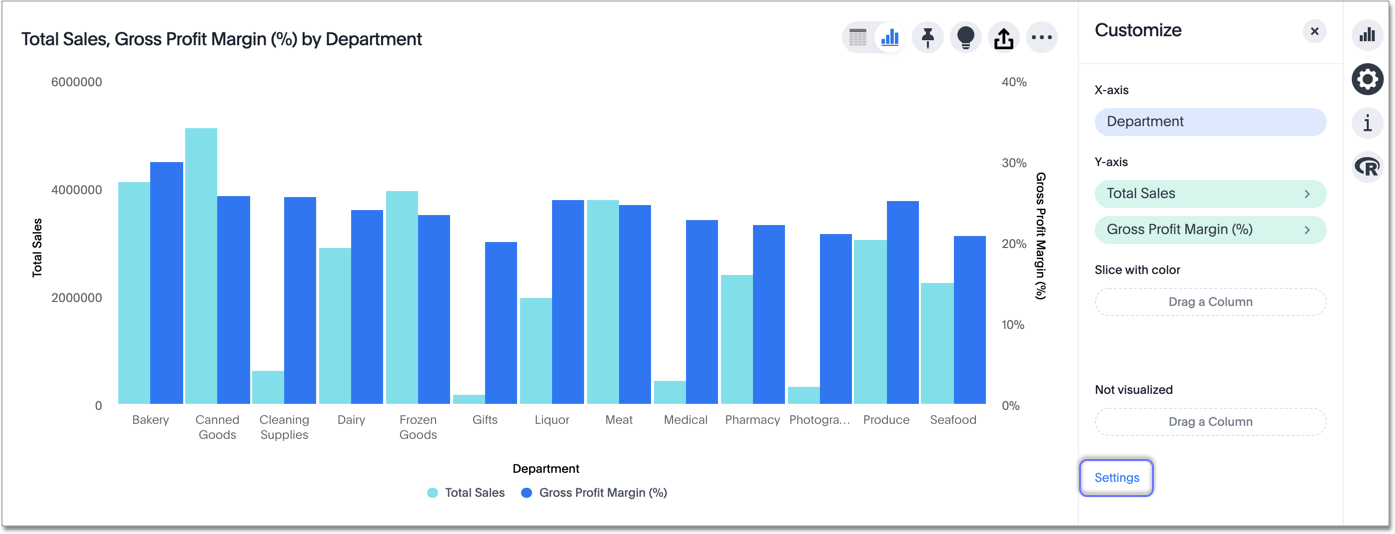
While viewing your search or Answer as a chart, select the chart configuration icon
 on the upper right.
 -
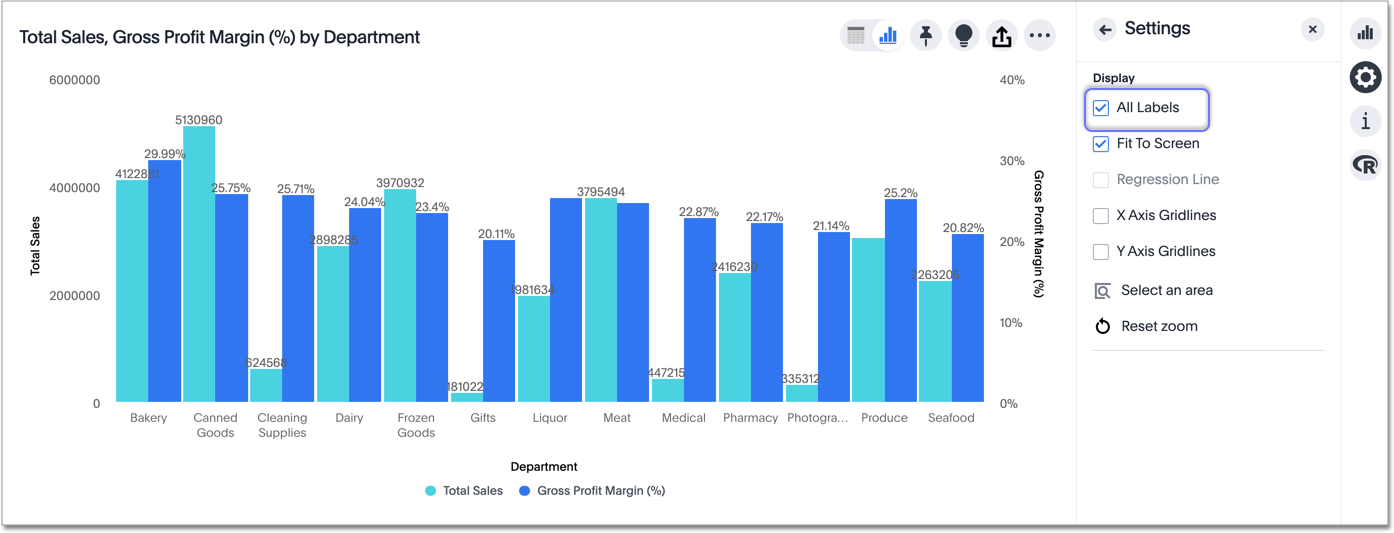
Select Settings on the lower right.
-
Select the All labels checkbox.
To further configure the labels, by showing un-rounded numbers for example, configure labels individually.
Configure labels for one measure
-
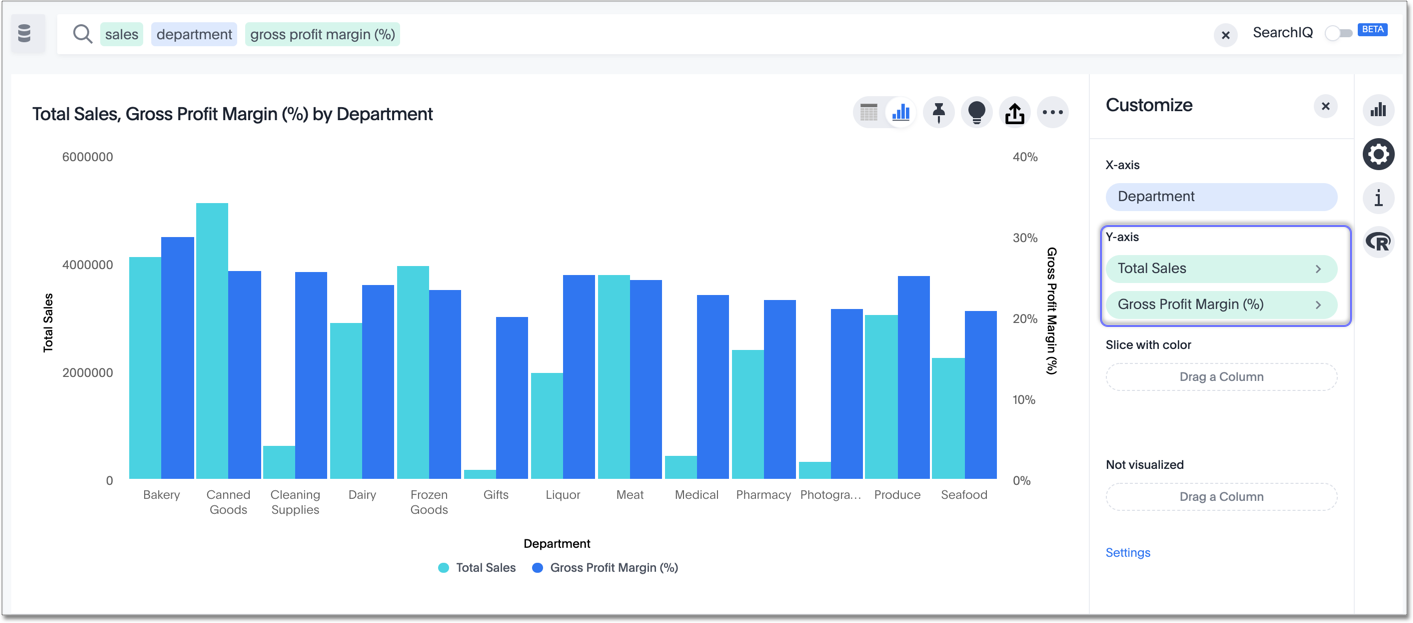
While viewing your search or Answer as a chart, select the chart configuration icon
on the upper right. -
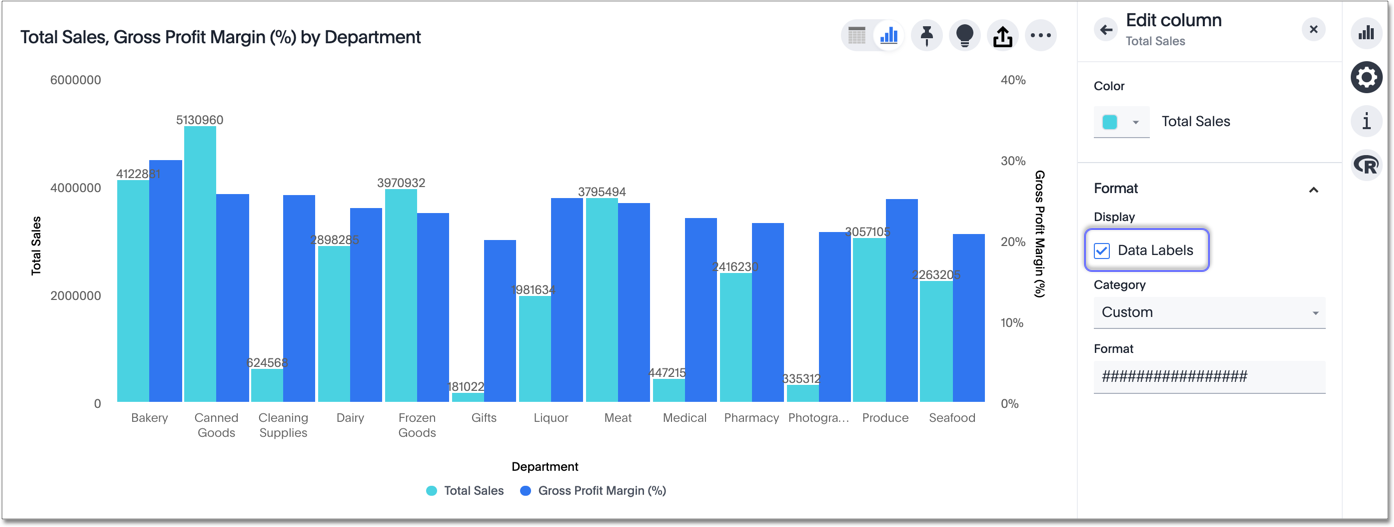
Select the measure you want to add labels to.
-
Select the Data Labels checkbox.
Note that only the Total Sales data has labels.
-
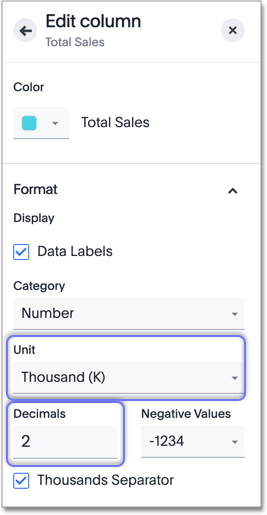
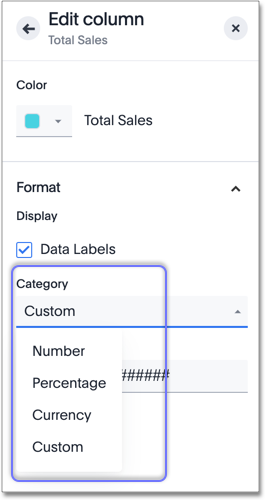
You can specify a category, like number, percentage, or currency. Otherwise, ThoughtSpot automatically picks the best category for your data.
-
When you specify a category, you can also specify units. Select none to see your data down to two decimal points, for example, or select millions to see labels rounded to the millions.
You can also specify the number of decimal places.