Comparative analysis
With SpotIQ comparative analysis, you can compare two data points for complex measures.
SpotIQ comparative analysis compares data points of simple or complex measures using these aggregates:
-
Sum
-
Count
-
Sum over sum, which generate a Liveboard that has 'what-if' percentage insights
-
Average, which generate a Liveboard that has 'what-if' percentage insights
-
Other functions which use a 'versus' analysis to show the absolute change grouped by different drill attributes
Contextual change analysis
ThoughtSpot supports contextual change analysis for area, line, column, bar, line-column, pie, and KPI charts. You do not need SpotIQ privileges to run contextual change analysis.
To perform this analysis, follow these steps:
-
On an area, line, column, bar, line-column, pie, or KPI chart, hold down the command key (MacOS) or control key (Linux or Windows).
-
Select the two columns or data points you plan to compare.
Note that if you are analyzing a KPI chart, you must either click the percent change label or select two points from the sparkline visualization. You cannot run change analysis on a KPI chart with no sparkline visualization. -
Right-click to see the dropdown menu, and select Run change analysis.
-
The SpotIQ window modal appears with the results of your analysis. By default, SpotIQ picks the top 5 most relevant columns, based on what it learned from your past activity.
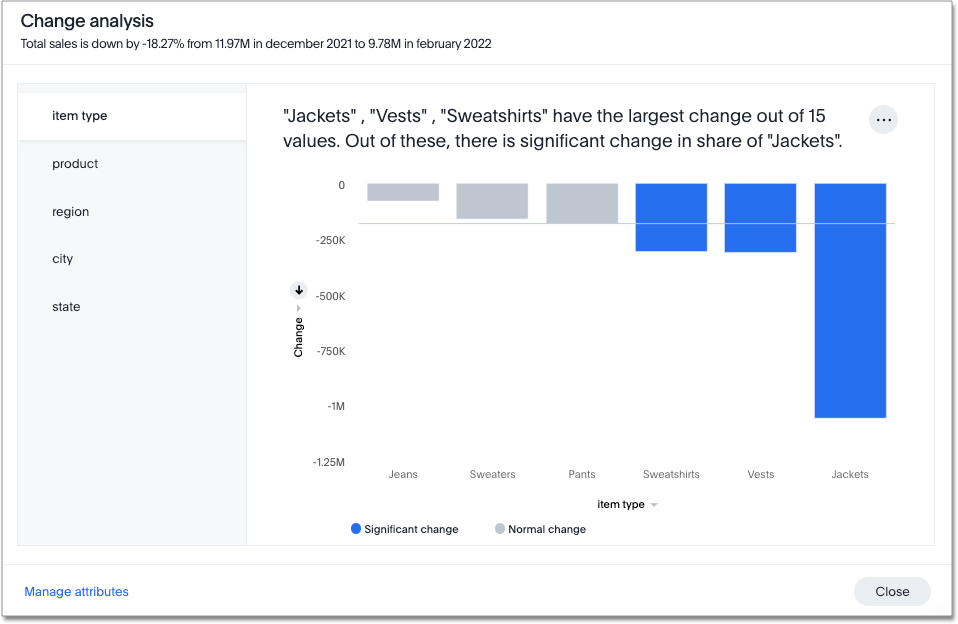
To select other columns to analyze, click Customize attributes in the lower left corner of the window and select the desired column from the window that appears.
Each colored section of a SpotIQ insight represents a statistically significant outlier among the values of your chosen columns. For more information on how statistically significant outliers are calculated, see Z-scores. -
You can now examine each visualization of the analysis for details of comparison.
In some instances, ThoughtSpot may point out that certain attribute values account for more than 100% of the total change. This is generally for cases where attribute values contribute to a trend that is opposite to the total change (positive change when the overall trend is negative, for example). You may see cases, for example, where two attribute values account for a 300% increase in sales, while the remaining attribute values indicated account for 200% of the total decrease. -
You can add the specific visualization to an existing Liveboard, or create a new Liveboard and add it there.
-
You can run another round of SpotIQ analysis, download the data as a CSV file, edit this visualization, or make a copy of the visualization.
Advanced comparative analysis in SpotIQ
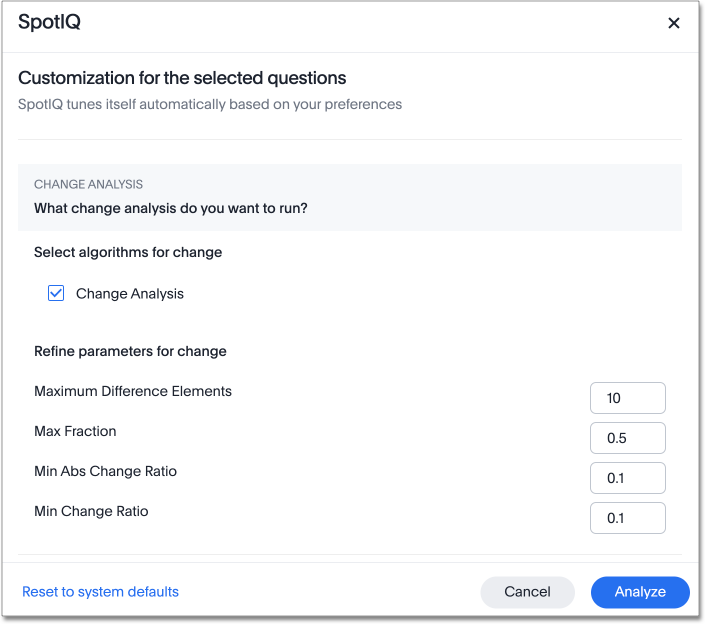
ThoughtSpot ships with a number of comparative algorithms. Using the Advanced option of SpotIQ, you can adjust the parameters of the analysis, or choose a different comparative algorithm for your data.
After selecting the relevant analysis columns, select Customize parameters.
Under Select Algorithms, select the name of the algorithm. You may have several options available, or only a single one. In this example, the only valid option is Change Analysis.
Under Refine parameters for change, adjust the options. In this example, the algorithm parameters are Maximum Difference Elements, Max Fraction, Min Abs Change Ratio, and Min Change Ratio.
How SpotIQ calculates outliers
Z-Score
A Z-score represents the number of standard deviations from the mean a data point is. Z-scores are a way to compare results from a test to a “normal” population. The basic Z-score formula for a sample is: z = (x – μ) / σ where
-
σ is the standard deviation
-
μ is the mean
-
x is the data value.
Currently, any value outside μ +/- N * σ (i.e. Z-score less than or greater than N) is an anomaly. N is determined based on the number of rows. It is chosen such that the max or min has < 0.1 probability of crossing the threshold. SpotIQ uses the following table to approximately choose the value of N, that is, how many standard deviations we want to be able to use as threshold:
| Cardinality | N (number of standard deviations from mean) |
|---|---|
< 20 |
2 |
< 500 |
3 |
< 10000 |
4 |
>= 10000 |
5 |


