Line column charts
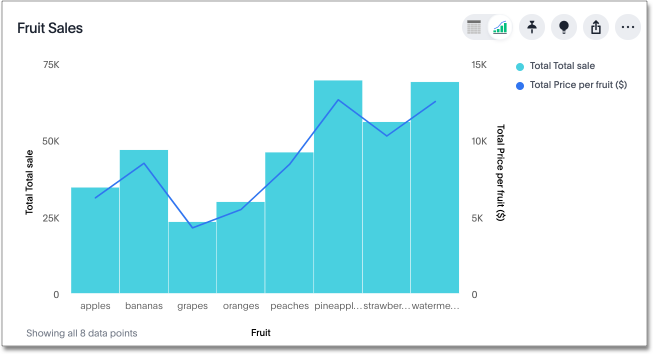
The line column chart combines the column and line charts. Your search needs at least one attribute and two measures to be represented as a line column chart.
Line column charts display one measure as a column chart, and the other as a line chart. Each of these measures has its own y-axis.
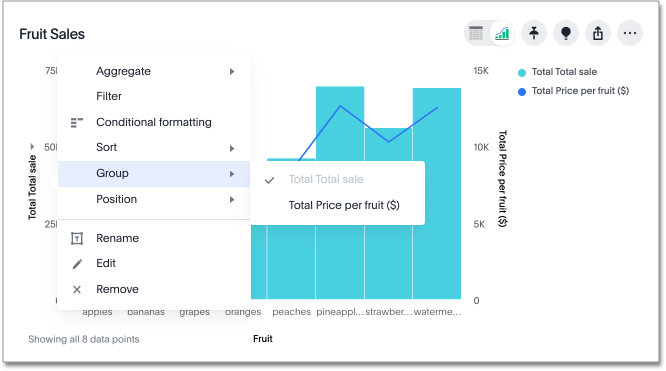
You can enable a shared y-axis by clicking the dropdown menu icon ![]() next to the y-axis label and selecting Group for both measures.
next to the y-axis label and selecting Group for both measures.
See also Line stacked column charts.
Was this page helpful?Give us feedback!


