Show underlying data
Viewing the underlying data of your answer gives you an un-aggregated view of the underlying data. You can see the most granular details of a given result set, the un-aggregated view.
This feature lets you understand what an answer consists of.
For example, if you search for customer region revenue, the answer shows the aggregate revenue value for each customer region.
Then, you can right-click any row and then select Show underlying data, to see each value which constitutes revenue for any given region.
Only the first 1,000 rows appear when viewing the underlying data. You can even download the results shown when you choose Show underlying data from a chart. The download file limit is a million rows.
| ThoughtSpot does not support showing underlying data for searches based on schemas with chasm traps. |
To show underlying data:
-
Right-click the visualization or table cell of interest.
-
Select Show underlying data.
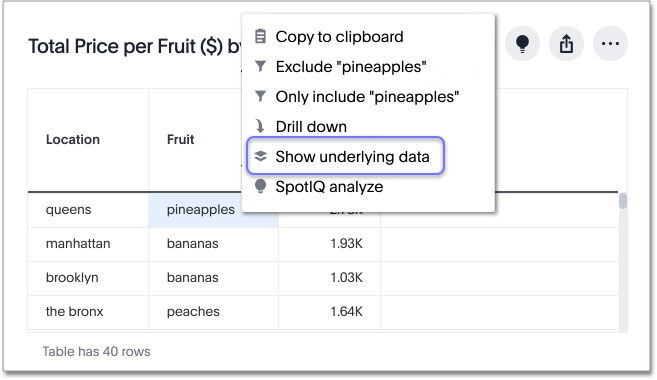
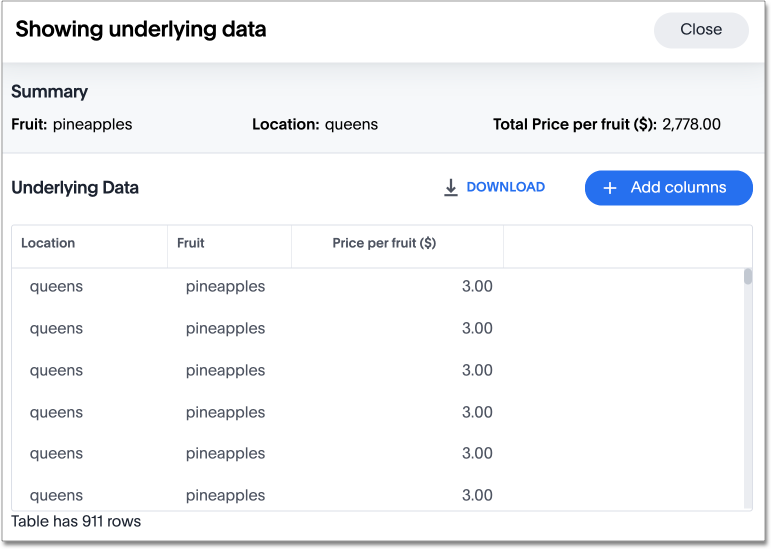
A new window opens that displays a summary and the underlying data.
-
Optionally, choose to + ADD COLUMNS to add additional data.
-
Select CONFIRM CHANGES.
-
Select DOWNLOAD to download a CSV file of the data.


