Geo heatmap charts
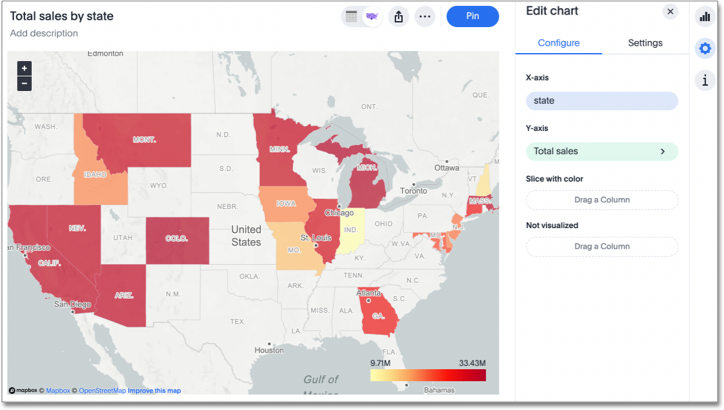
Geo heatmap charts display the value of the measure through the depth of color of the area. Use geo heatmap charts to see the relative value or density of a measure by location (for example, "sales" relative to "customer zip code").
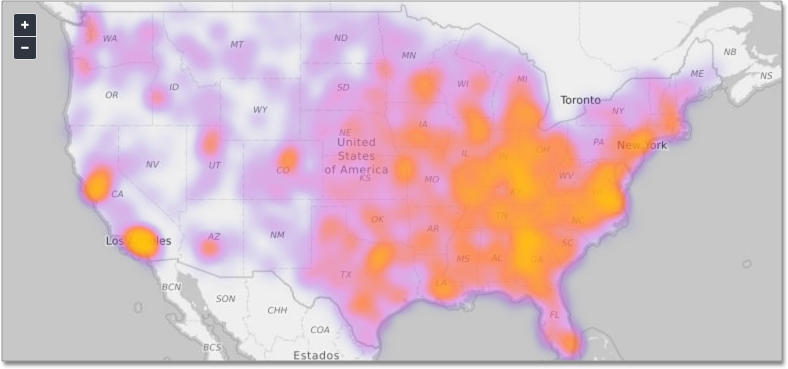
To use the geo heatmap chart, your search must include a geographical column, or a longitude and latitude pair. ThoughtSpot supports geographical visualizations for many countries; see Geo map reference for details.
See also the full introduction to Geo charts and the specifics of working with them.
Geo chart customizations
Geo charts allow you to customize the map display by changing the Map type.
To customize the Map type, follow these steps:
-
Navigate to any geo chart that you have edit privileges for.
-
Select the edit chart icon
 on the left side of your screen.
 -
Select Settings in the Edit chart panel.
-
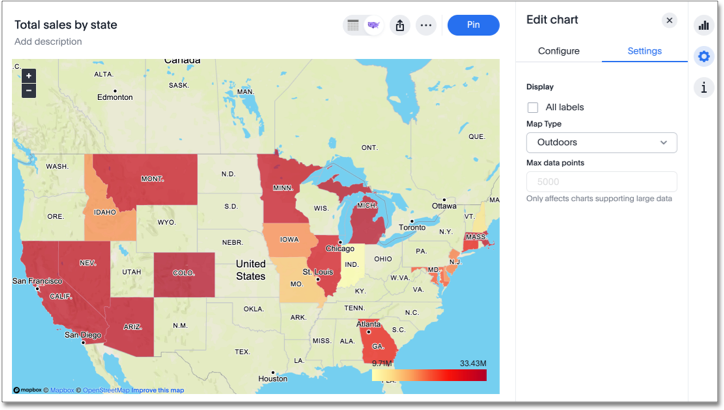
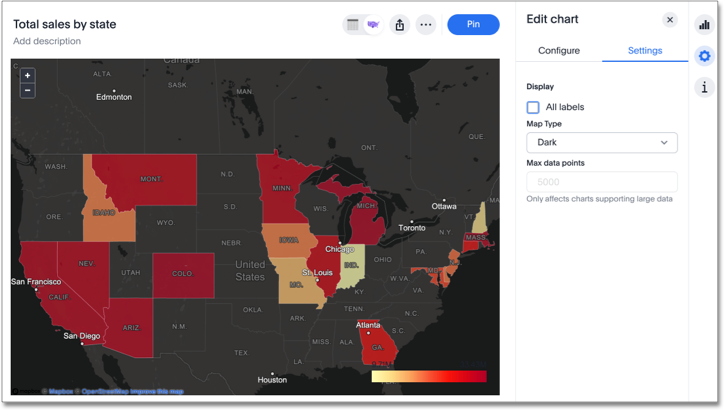
Click on the Map type dropdown, and select one of the options: Light, Dark, Outdoors, Streets, Satellite, or Satellite Streets. The default is Light.
For example, view the Light (default), Outdoors and Dark map types: