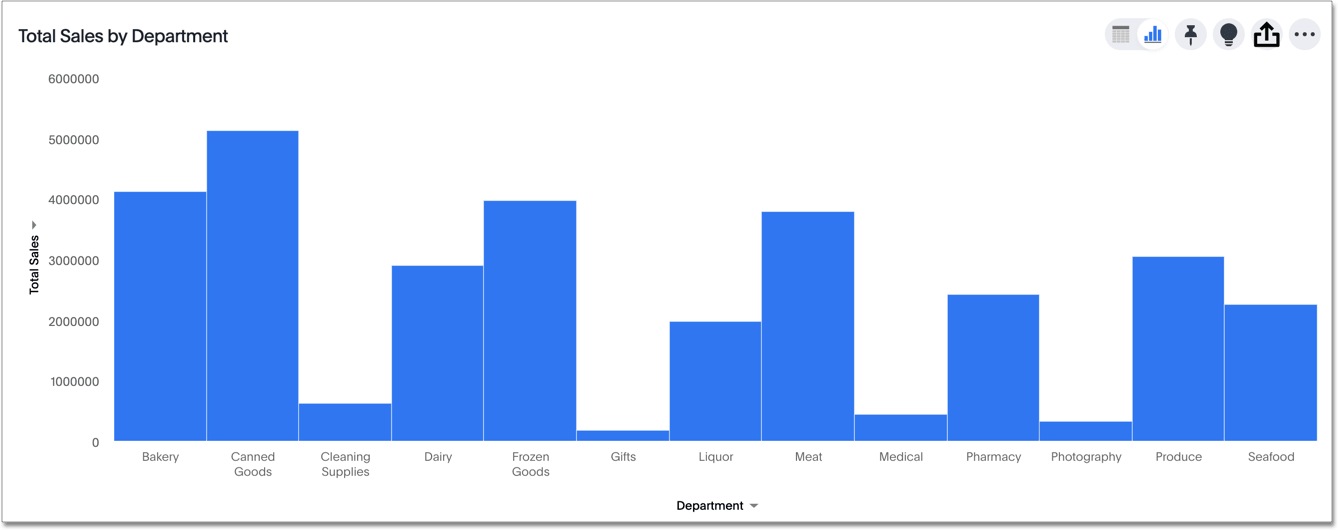
Column charts
Column charts are vertical bar charts that display your data using rectangular bars. The length of the bar is proportional to the data value.
The column chart is one of ThoughtSpot’s simplest, yet most versatile chart types. ThoughtSpot often default to this visualization.
Your search must have at least one attribute and one measure to be represented as a column chart.
See also Stacked column charts.
Was this page helpful?Give us feedback!


