Table status Liveboard
The TS Stats: Table Status Liveboard in the Admin Console shows all the stored tables with details on the last update time, time taken for auto-indexing, number of rows, and so forth. It also contains information about tables loaded in your cluster, and whether those tables and their tokens are indexed and searchable.
To view the Table Status Liveboard, select Admin from the top navigation bar. Select Table status from the side navigation bar.
Relational Data Cache
This section reports real-time information about tables in your cluster. Worksheet data is not included.
- TABLES LOADED
-
Number of currently loaded tables.
- TABLES BEING UPDATED
-
Number of table loads in-progress.
- NEW TABLES BEING LOADED
-
Number of tables being loaded for the first time.
- ROWS
-
Number of rows combined across all tables in ThoughtSpot.
Relational Search Engine
- TABLES SEARCHABLE
-
Tables that are indexed and can be searched.
- TABLES BEING INDEXED
-
Total of in-progress table indexing.
- NEW TABLES BEING INDEXED
-
Total of first-time, in-progress table indexing.
- TOKENS SEARCHABLE
-
Number of tokens of all table (combined) indexed in ThoughtSpot.
You can select a column name to sort by table name. This table information is based on an underlying system data. You can present it or copy the link, but you cannot access the underlying query.
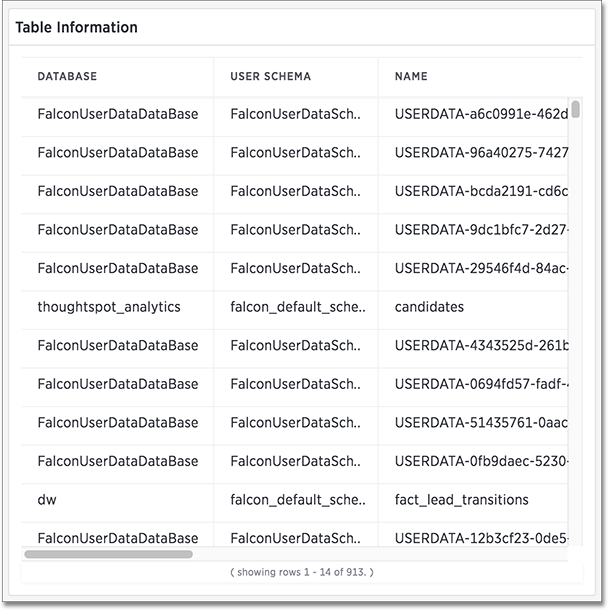
Table information
The Table information table shows all the stored tables with details on the last update time, time taken for auto-indexing, number of rows, and so forth.
Database Status
The Database Status column can have the following possible values:
- READY
-
The data has been loaded.
- IN PROGRESS
-
The data is still being loaded.
- STALE
-
The data is not up-to-date.
- ERROR
-
The table is invalid. Contact ThoughtSpot support.
Replication Status
The Replicated column indicates if the table has been replicated or sharded. This can be used in conjunction with the Total Shards column to see how your data is distributed.
If the table is replicated on a multi node system, the Used Capacity (MB) column will indicate the total space used on all nodes. For example, a 10MB table replicated on a 4 node system will show 40MB used capacity.
Search Status
The Search Status column can have the following possible values:
- READY
-
The data is up-to-date and searchable.
- NOT READY
-
The data is not ready to be searched.
- DELETING INDEX
-
The table has already been deleted, but the index still exists due to the latency between the database and search engine.
- INDEXING DISABLED
-
Either too many tokens exist in a column for it to be indexed, or indexing has been disabled manually.
- CREATING INDEX
-
The index is being created.
- UPDATING INDEX
-
A change has been made to indexing or the data, and the index is being updated to reflect it.
Node information
The Node information table lists the IPs of the nodes in your cluster, their Ramdisk usage in megabytes, and their total capacity in megabytes.


