Gauge charts
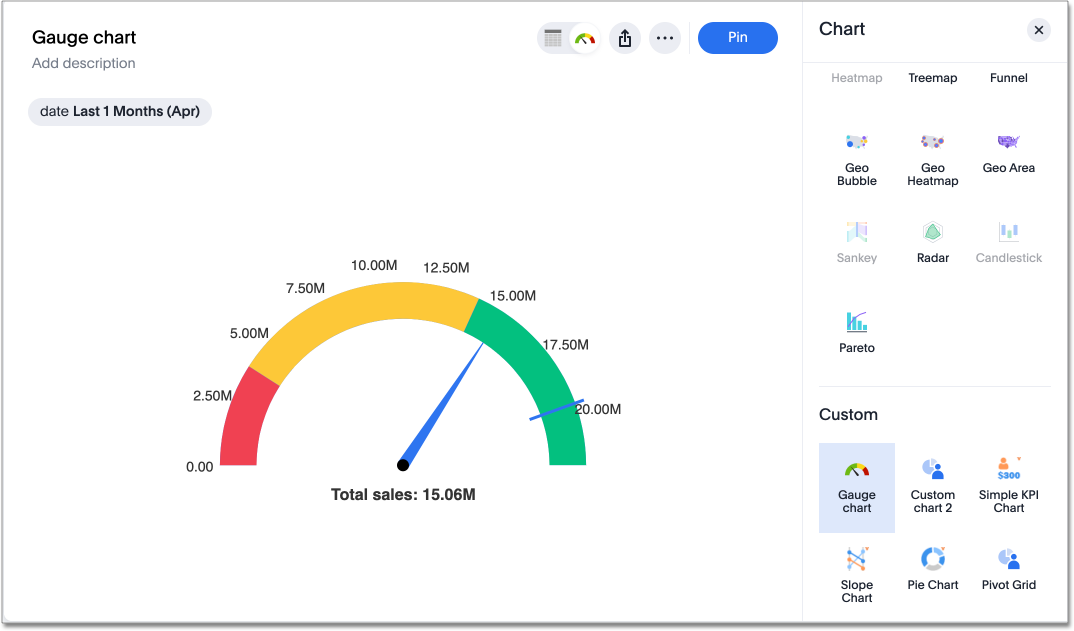
The gauge chart is a type of chart that can be used to provide an instant view of a measure or a formula’s current value.
This chart is displayed under the Custom category and is available only when the custom charts feature enabled. To add this chart to your ThoughtSpot cluster, contact your ThoughtSpot administrator.
Was this page helpful?Give us feedback!


