Add a filter to a table
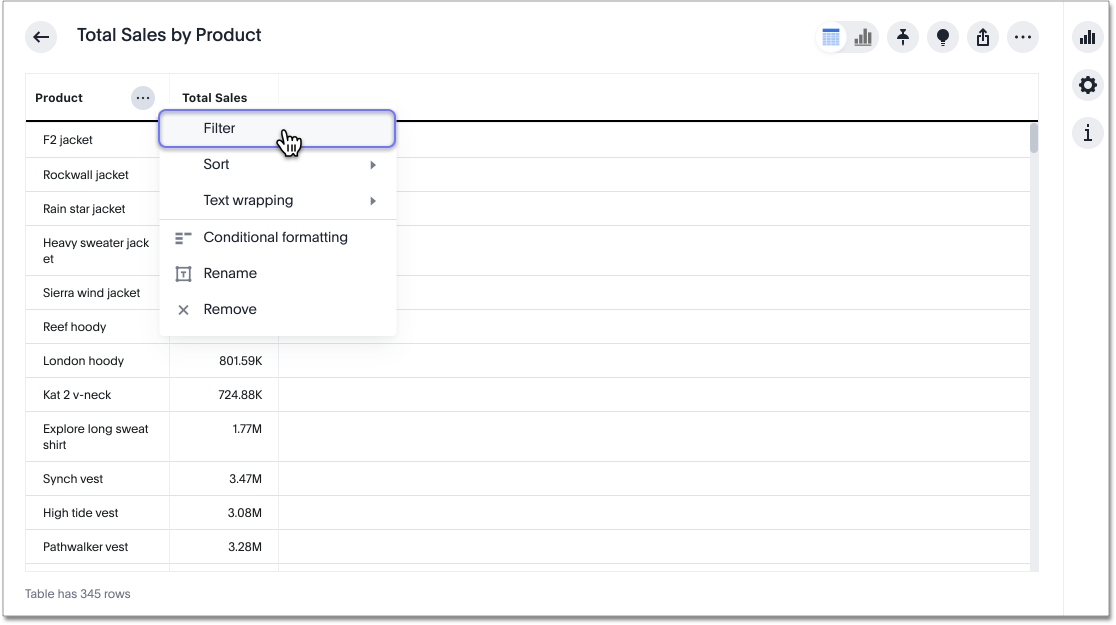
To add a filter from column headers:
-
While viewing your Answer as a table, hover over the column header you want to filter, and select the More icon
 .
.
-
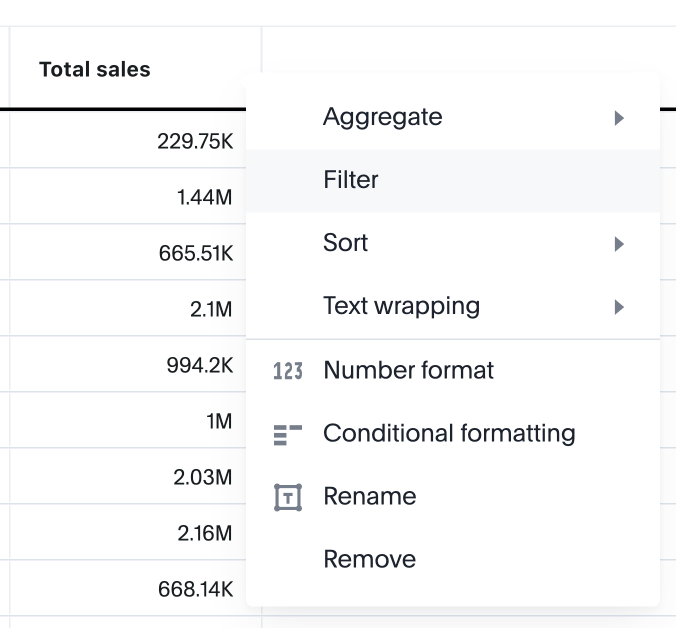
Select Filter.
-
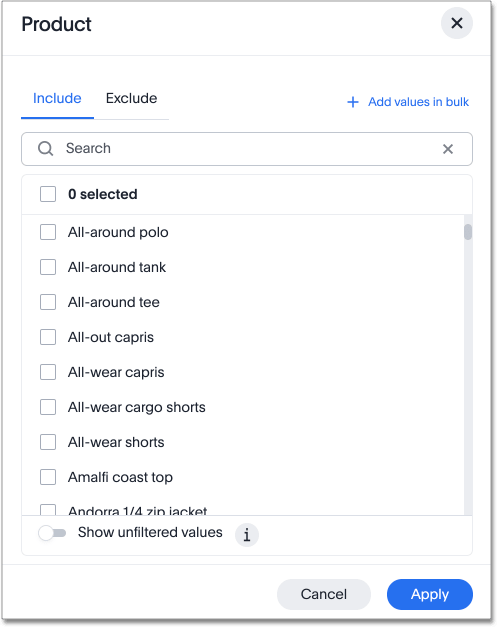
The filter modals for attributes and measures are different. The modal for an attribute looks like this:

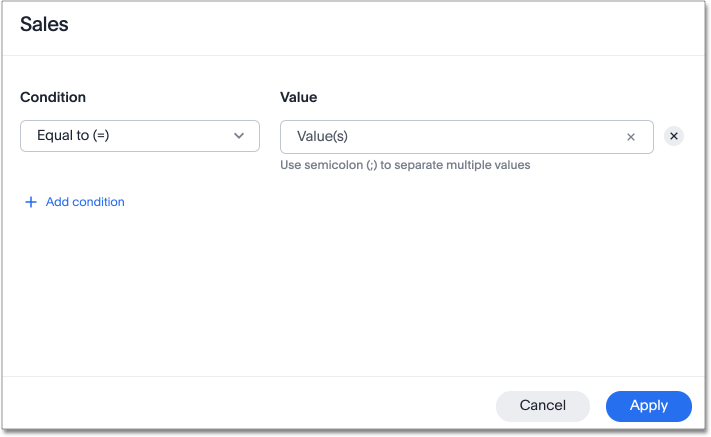
The modal for a measure looks like this:

-
For an attribute filter, select values to include or exclude. You can also select all or clear all. If there are too many values, you can use the filter search bar to find the ones you want. The filter modal only shows 500 values; if the column you selected has more than 500 values, you must use the filter search bar to find the additional values.
-
For a measure filter, select Add a condition. Choose an operator, such as is greater than, and enter a number. For example, to see under-performing stores, with sales under 10 million, select is less than or equal to and enter 10 million. To add another filter for that measure, select Add another.
For measure columns, filtering is done at the same aggregate level as that of the column. For example, say that a table has three columns: City (attribute), count of stores, and Total Sales (aggregate measure column). The values in the Total Sales column are the sum of all sales from all the stores within the corresponding city. Applying a filter to the Total Sales column does not consider individual sales values at a store level. Rather, the filter is applied on city-level sales. So if the filter is Total Sales > 0, it only includes those cities (and not stores) whose aggregate sales are positive. In other words, all the cities with at least one store having positive sales are included. It does not matter if some of the stores (but not all) in the given city have zero sales, the city is still included. 
-
Select Done.
Related information


