Custom charts
You can now use custom charts created outside of ThoughtSpot.
This article describes how you use a custom chart and how your ThoughtSpot administrator can add, edit, and delete custom charts.
Developers create custom charts in Javascript using charting libraries such as Highcharts. For more information, refer to ThoughtSpot Charts SDK documentation.
To enable custom charts, you must contact ThoughtSpot Support.
Using custom charts
To use a custom chart, do the following:
-
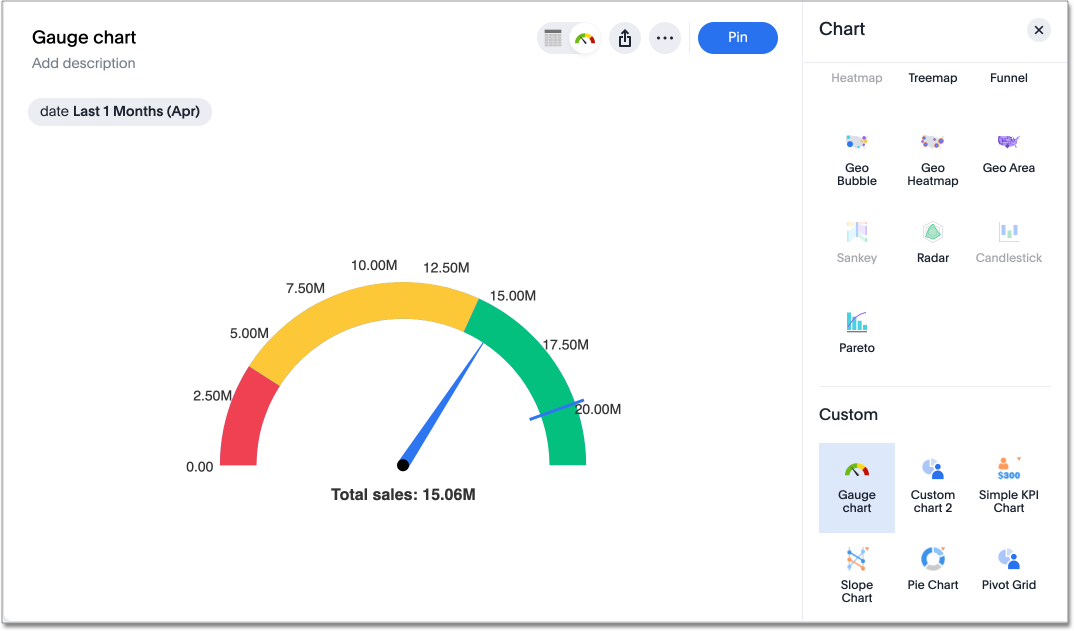
Click the Change visualization button
 .
. -
Below the list of default charts, select a custom chart.
Administering custom charts
A ThoughtSpot administrator can add custom charts to your cluster, as well as edit and delete them. Before adding custom charts, the administrator must add the domains where the custom chart and chart icon are hosted to the list of permitted iFrame and CSP img-src domains in ThoughtSpot. Without performing this step, the custom chart cannot be loaded.
Adding domains to the permitted iFrame and CSP img-src domains
The ThoughtSpot administrator must enter the domain for both the chart and the chart icon.
To add the domain for a custom chart and chart icon, do the following:
-
Select Develop from the navigation bar.
-
Navigate to All Orgs > Security settings.
-
Click Edit.
-
In the Permitted iFrame domains field enter the domain where the custom chart is hosted.
-
In the CSP img-src domains field enter the domain where the custom chart icon is hosted.
-
Click Save Changes.
Adding a custom chart to a ThoughtSpot cluster
To add a custom chart, the ThoughtSpot administrator does the following:
-
Select Admin in the top navigation bar.
-
Under Application settings, Select Chart customization.
-
Select the Custom charts tab.
-
Click Add chart
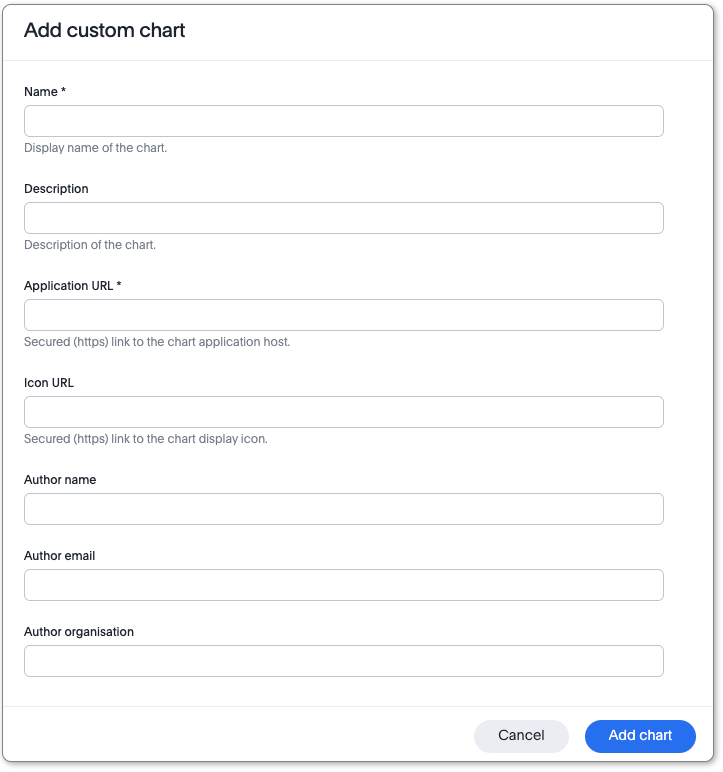
The Add custom chart window appears.
-
Enter the following fields:
-
Name
-
Description (optional)
-
Application URL
-
Icon URL (optional)
-
Author name (optional)
-
Author email (optional)
-
Author organization (optional)
-
-
Click Add chart.
Your new chart appears on the Custom charts page, and is now available for use when creating a chart in ThoughtSpot.
Editing a custom chart
To edit a custom chart, the ThoughtSpot administrator does the following:
-
Select Admin in the top navigation bar.
-
Under Application settings, Select Chart customization.
-
Select the Custom charts tab.
-
Find the name of the chart you want to change, and click Edit.
-
In the Update custom chart window, make any changes necessary, then click Update chart.
Deleting a custom chart
To delete a custom chart, the ThoughtSpot administrator does the following:
-
Select Admin in the top navigation bar.
-
Under Application settings, Select Chart customization.
-
Select the Custom charts tab.
-
Find the name of the chart you want to delete, and click Delete.
-
In the Delete custom chart warning message which appears, click Delete.


