Save and share R visualizations
You can save and share R analyses as answers and pinboards.
In terms of sharing, the R visualization you get as a result of running a script is similar to any other search result in ThoughtSpot. You can save it, share it, and add it to pinboards.
Save an R visualization
-
Click the More icon
 above the generated graphic or table containing your analysis, and select Save from the menu.
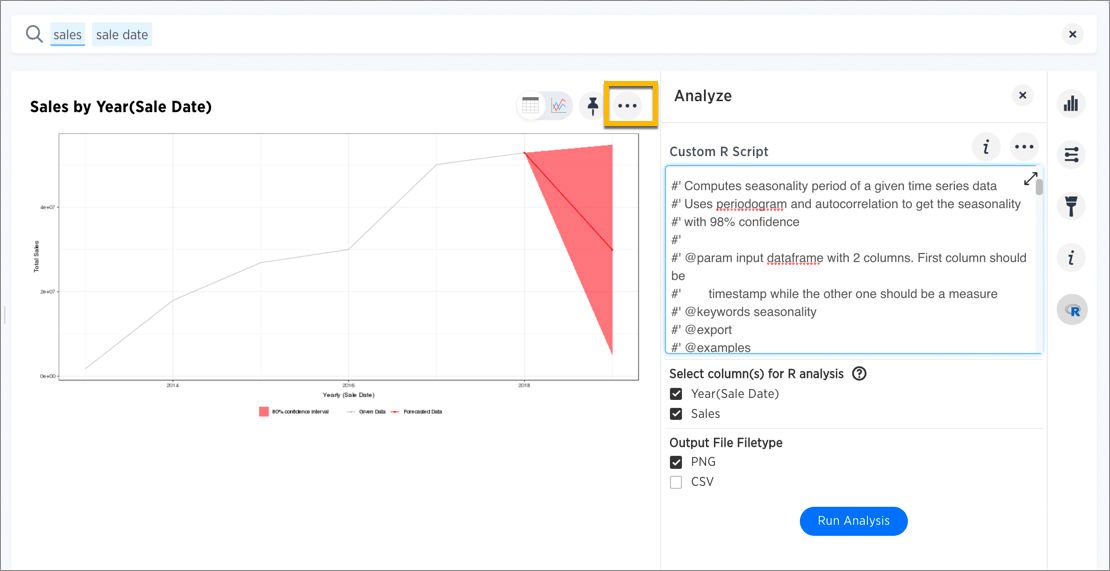
-
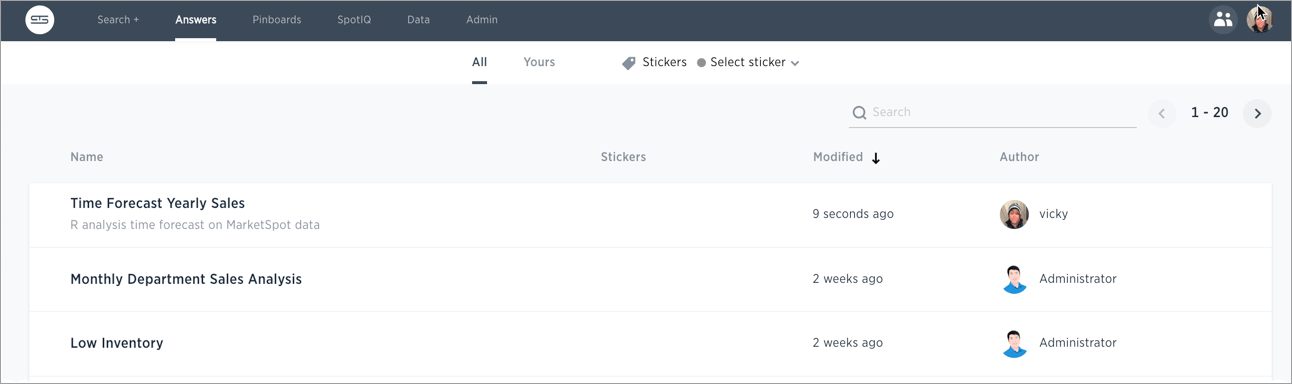
Add a name and description for the analysis, and click Save.
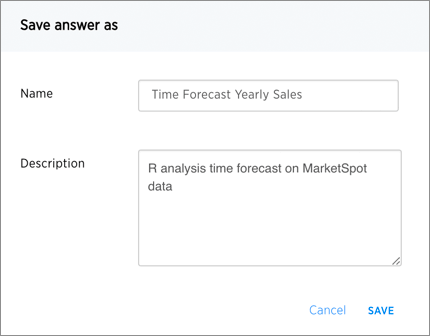
The saved analysis is added to Answers.
Share an R visualization
-
Click the More icon
above the generated graphic or table containing your analysis, and select Share from the menu.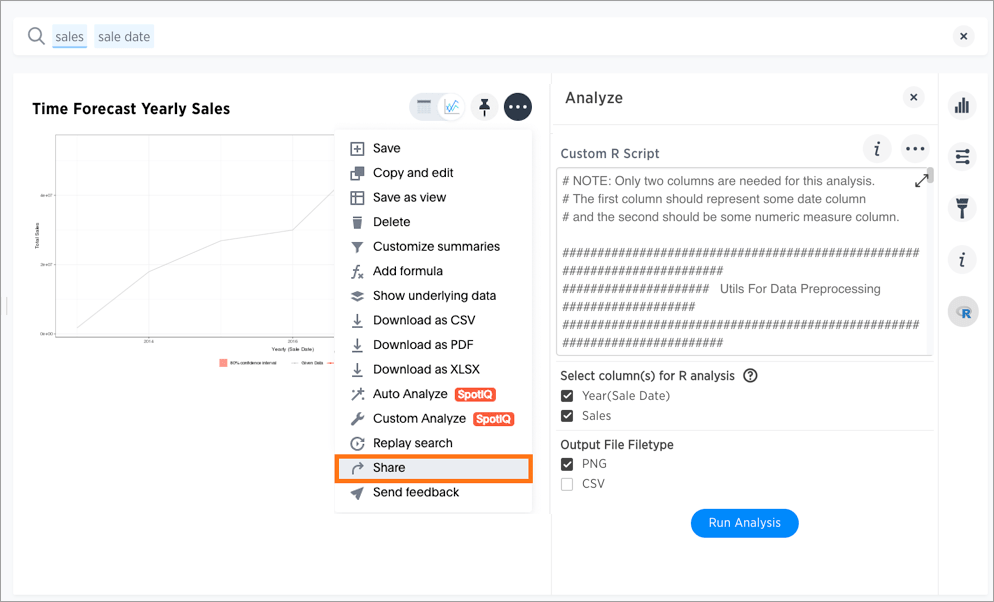
-
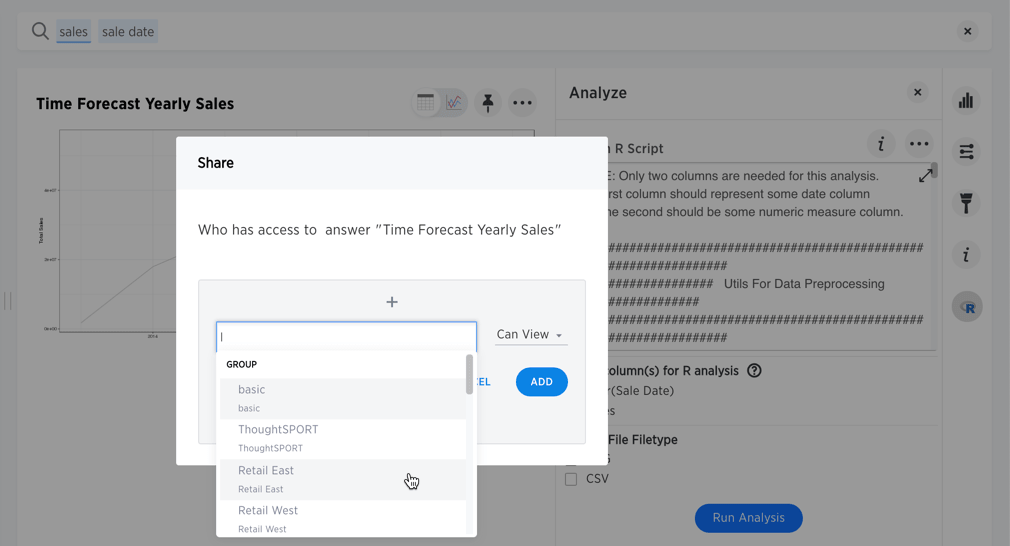
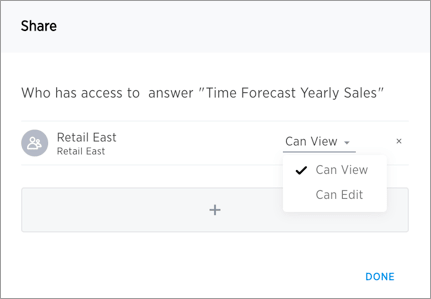
Select and add the user or group with which to share, along with level of access (Can View, Can Edit), and then click Done.
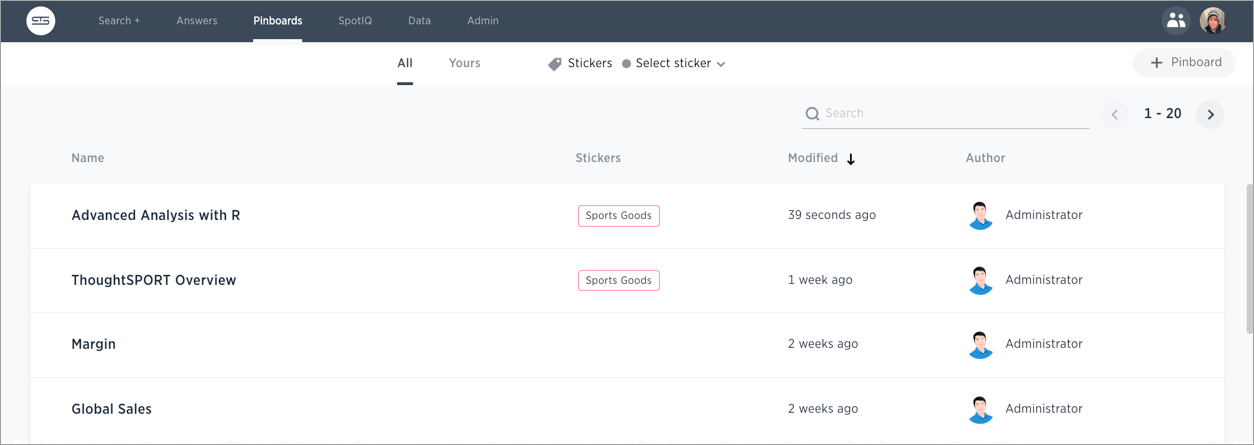
Add an R visualization to a pinboard
-
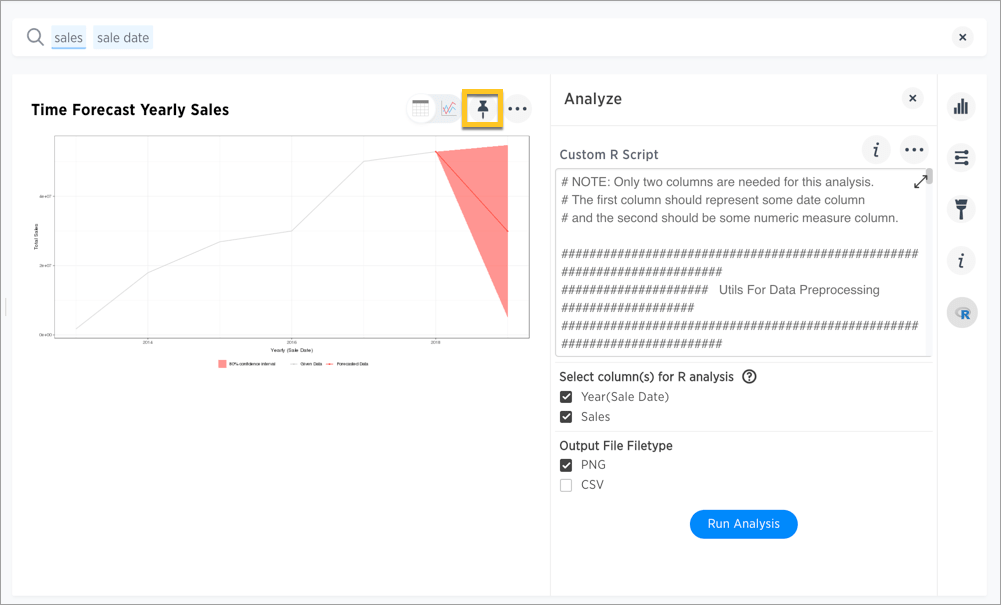
Click the pin above the generated graphic or table containing your analysis.
-
Create a new pinboard or select an existing pinboard, then click Done.
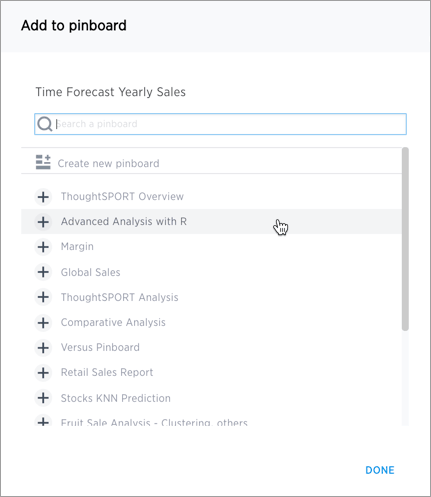
The visualization is available in Pinboards.