Geo charts
There are three geo charts that let you visualize geographical data in ThoughtSpot.
Geo charts show data on a map by location. They are geo area, geo bubble, and geo heatmap charts. And these geo charts can display six types of geographical data, depending on territory:
-
Country
-
State
-
County
-
Zip code
-
Point (latitude/longitude)
-
Other sub-nation regions (for international countries)
ThoughtSpot supports maps many countries. Please see the complete list in Geo Map Reference.
Displayed Geo data
Here is a table that shows which GeoType data can be displayed using which geo chart type.
| GeoType | Data Type | Geo chart type | Notes |
|---|---|---|---|
Country |
VARCHAR |
Geo area (default), geo bubble, geo heatmap |
Can also be regions. |
County |
VARCHAR |
Geo area (default), geo bubble, geo heatmap |
Only for counties in the United States. |
Latitude (point) |
VARCHAR or DOUBLE |
Geo bubble (default), geo heatmap |
Must use both latitude and longitude columns. |
Longitude (point) |
VARCHAR or DOUBLE |
Geo bubble (default), geo heatmap |
Must use both latitude and longitude columns. |
State |
VARCHAR |
Geo area (default), geo bubble, geo heatmap |
Only for states in the United States. |
Zipcode |
VARCHAR |
Geo bubble (default), geo heatmap |
Refer to the Geo Map reference to see which countries have supported zip codes. |
Other sub-nation regions |
VARCHAR |
Geo area (default), geo bubble, geo heatmap |
The display depends on the type of administrative region. |
For data to display in geo charts, your administrator must configure it as geographical data. If you you don’t get an expected map visualization, contact your administrator so they can configure the system correctly.
Area charts
Geo area charts highlight the regions of interest, and display boundaries for various regions.
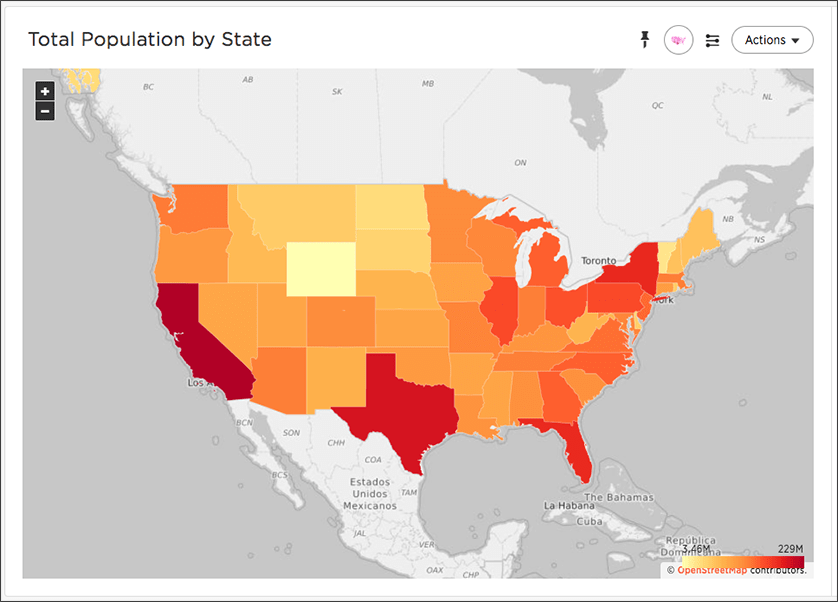
To paint a geo area chart, your search must include a geographical column with appropriate granularity. See Geo Map Reference.
Geo bubble charts
Geo bubble charts, like bubble charts, display the value of the measure through the relative size of the bubble. Zip code data is a good choice for geo bubble charts.
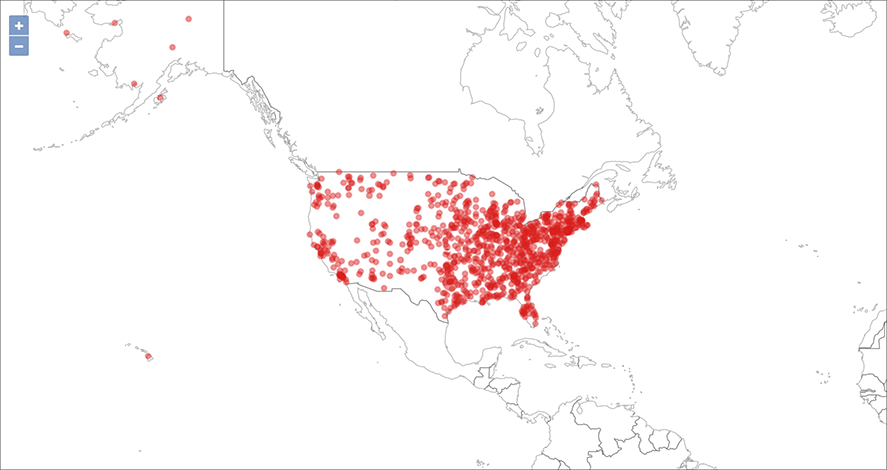
To paint a geo bubble chart, your search must include a geographical column, or a latitude and longitude pair.
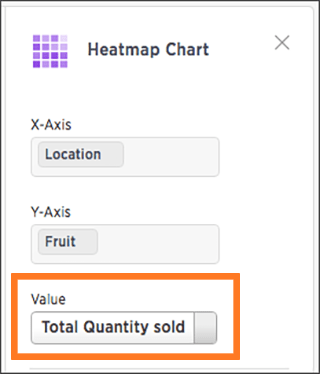
Heatmap charts
Heatmap charts are similar to treemap charts: they both use a similar system of color-coding to represent data values. However, the heatmap does not use size to measure data, and instead requires an additional attribute.
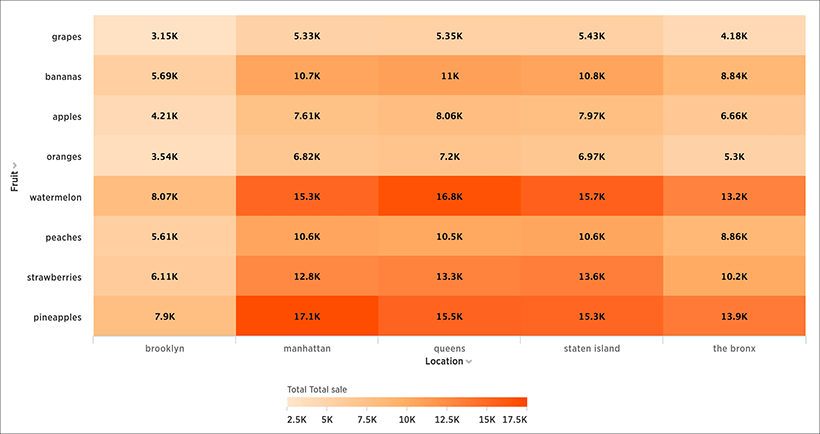
The value of each cell depends on the measure you choose under Edit chart configuration.