Change result display options
You can change how your search results (Answers) appear.
Your search results, or Answers, have various display options. You can change the visualization used to display your results, their sort order, how ThoughtSpot groups the data, and what data ThoughtSpot includes.
Change the view
You can change the view of your answer so it appears as either a table or a chart. To change the view of your answer:
-
View your answer.
-
Toggle between either a table or a chart type.
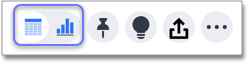
When you display your data as a chart, ThoughtSpot automatically selects the type of chart that works best for your data.
If you want to use another type, click the change visualization icon ![]() and select the type of chart you want.
Refer to understand charts.
and select the type of chart you want.
Refer to understand charts.
Sort your search
Sorting your search allows you to order your answer, making it easier to read. To sort your search:
-
If you are in the data (table) view, click the column header you would like to sort on.
By default, sorting applies in descending order. For example, if the column has numerical values, it would start at the highest number and decrease. Click the column header again to sort in ascending order.
Hold kbd:[shift] and click another column to add a secondary sort. You can even add tertiary sorting and so on by continuing to use this trick. -
If you are in the chart view, click the axis label of your chart that you would like to sort and select Sort. You can choose to sort in ascending or descending order.
Hidden sort
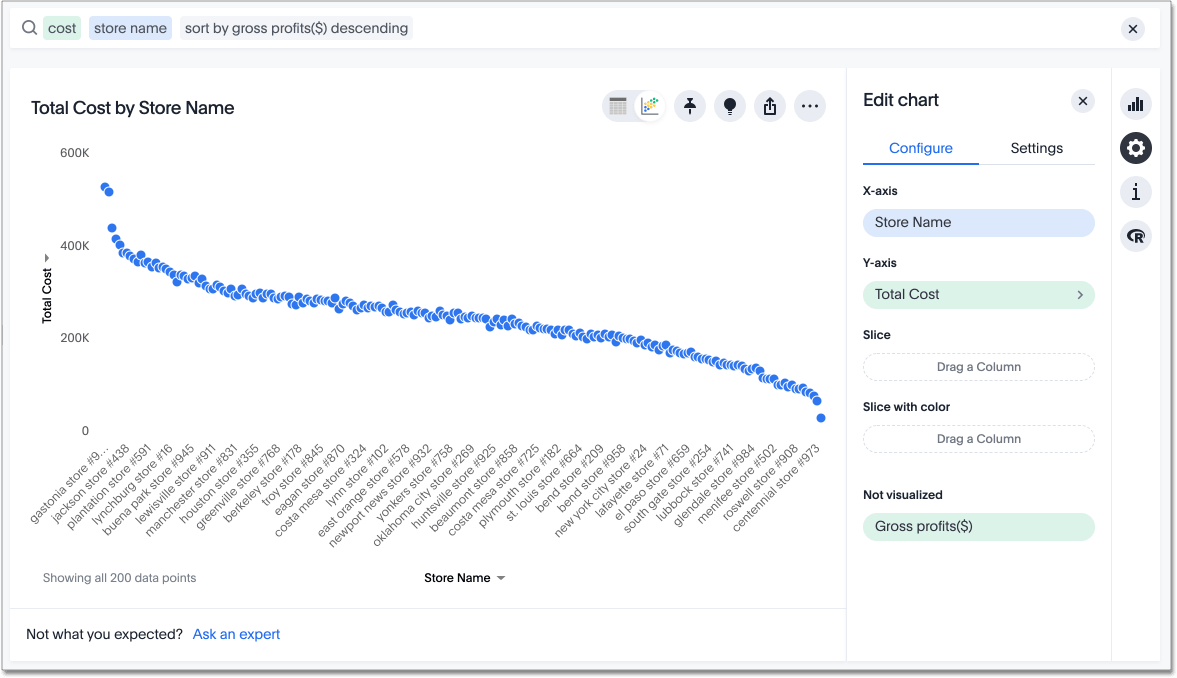
You can also sort by a measure that you do not want to include in the chart. For example, if you search for cost store name sort by gross profit margin, you can move gross profit margin to the Not visualized section from the Edit chart ![]() panel. ThoughtSpot sorts the chart by gross profit margin, but gross profit margin does not appear in the chart. This is also known as a hidden sort.
panel. ThoughtSpot sorts the chart by gross profit margin, but gross profit margin does not appear in the chart. This is also known as a hidden sort.
| You cannot perform a hidden sort on an attribute or date column. |
Change the date bucketing (grouping)
You can change the date bucketing on tables and charts for columns with date values.
Bucketing is a method for grouping a column in your data.
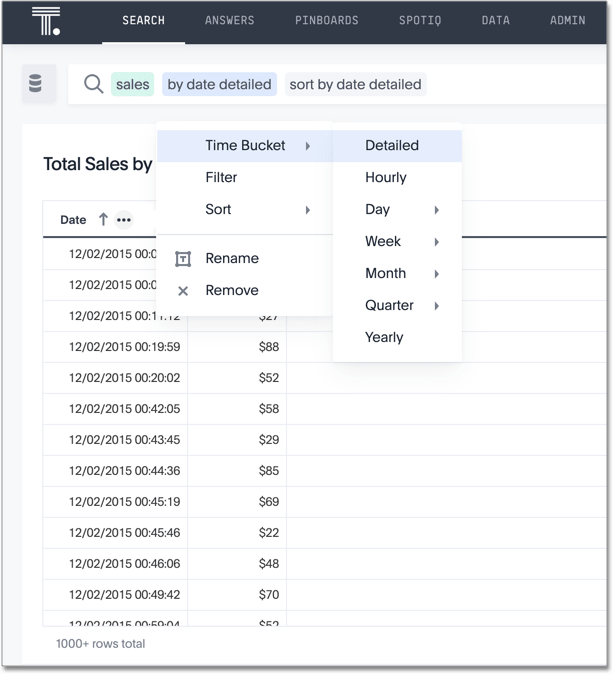
To bucket your data in a table view, click the ellipsis icon ![]() that appears when you hover over a column name on a table.
that appears when you hover over a column name on a table.
You can specify date bucketing at many granularities, from detailed (to the minute or second) to yearly, depending on your data. You can also specify bucketing based on the position of a bucket relative to another, larger bucket. For example, you can group data by month of quarter, or week of month.
To bucket your data in a chart view, click the dropdown icon ![]() that appears when you hover near the axis labels on a chart.
that appears when you hover near the axis labels on a chart.
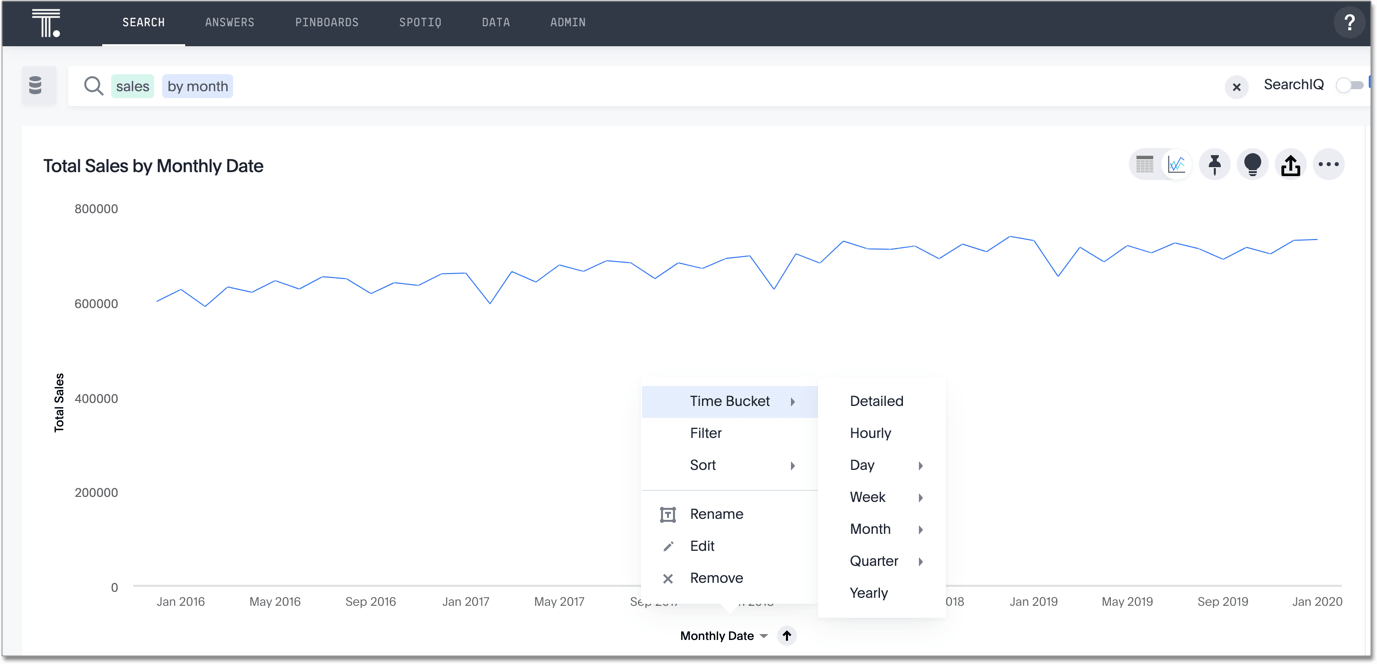
ThoughtSpot chooses a default date bucket for you when you search. This default takes the entire search result into account. For example, if your search includes last month, dates are bucketed daily instead of monthly.
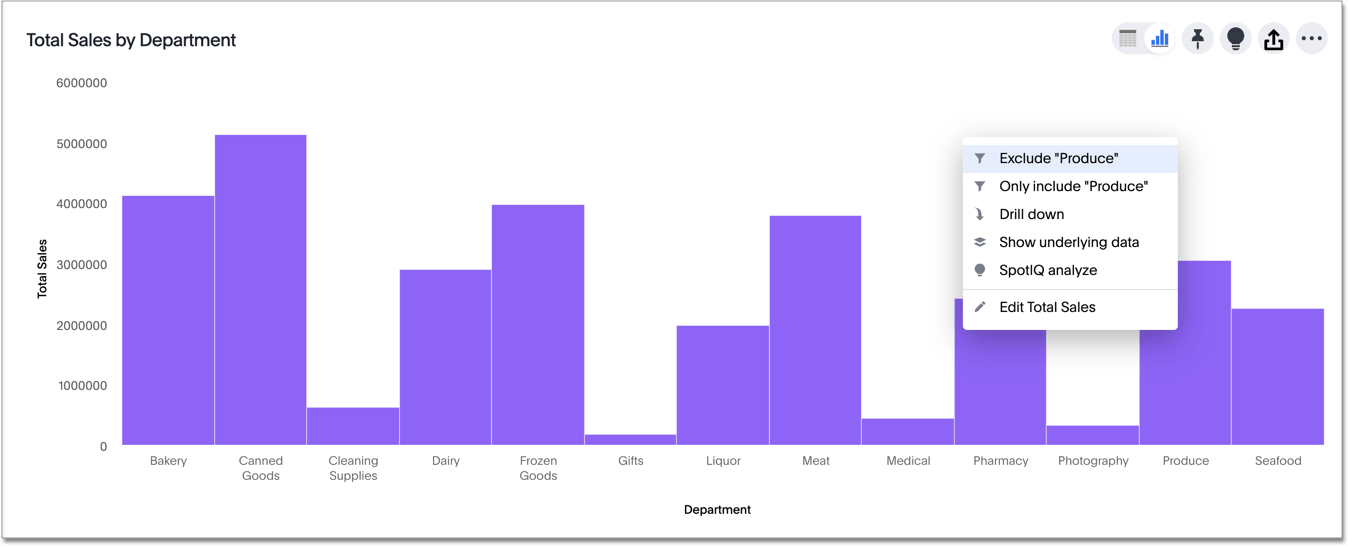
Exclude and include row values
You can include or exclude row values from your answer.
To exclude or include row values:
-
Right-click the visualization or table cell of interest.
-
Select Exclude "value" or Only Include "value" if available.