How users are searching answers Liveboard
The How users are searching answers Liveboard describes how users search existing Answers and Liveboards.
As an analyst, you need data to analyze to help you empower your users. For example, it is useful to know how your users are searching your existing Answers and Liveboards, so you can determine what objects are the most popular and what assets you may need to create. The How users are searching answers Liveboard, a default ThoughtSpot Liveboard that is visible to admins, provides this information. Review the best practices for this Liveboard.
If you do not have admin privileges and would like to access this Liveboard, ask your ThoughtSpot administrator to share the Liveboard and its underlying Model, Discover Monitoring Data, with you. Administrators, review the sharing best practices for this Liveboard.
To access the How users are searching answers Liveboard, search for "How users are searching answers" while searching among your existing Answers and Liveboards, or search on the Liveboards page.
The How users are searching answers Liveboard contains the following visualizations:
| Some or all of the visualizations on this Liveboard may be empty, if you do not have Search on Answers on in your environment, or if it is newly on, and few users have searched on it. You must also enable Mixpanel. To see the statistics on how your organization uses Search Answers, contact ThoughtSpot support. |
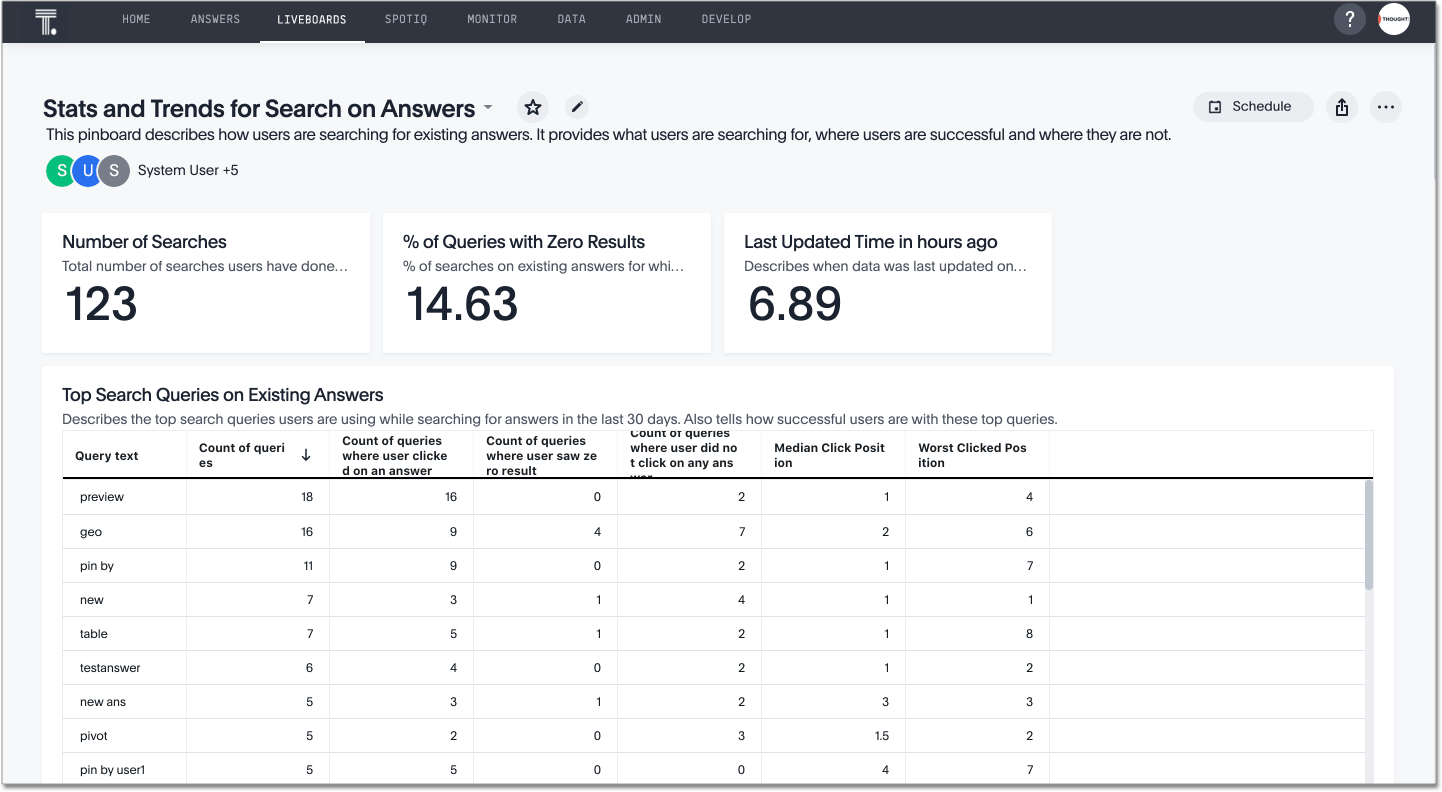
Number of searches
This KPI chart specifies the number of searches users have done on existing Answers and Liveboards in the last 7 days.
% of queries with zero results
This KPI chart specifies the percentage of searches on existing Answers and Liveboards that had no results. The lower the percentage of searches with no results, the better the user experience. If you have a high percentage of queries without results, consider building more Answers and Liveboards, or empower more users to build their own Answers and Liveboards by searching your data.
Last updated time in hours ago
This KPI chart shows the number of hours it has been since this Liveboard was automatically updated with new data.
Top search queries on existing Answers
This visualization lists users' most searched Answers and success rates for the last 30 days.
Top search queries with zero results
This visualization lists users' most common search queries for Answers with no results. These are the most common Answers and Liveboards users search for but do not find. Consider building Answers and Liveboards that answer these questions, or empower more users to build their own Answers and Liveboards by searching your data.
Top search queries on existing Answers where the user did not click on any result
This visualization lists users’ top search queries that did not result in a useful Answer or Liveboard. The users' queries returned results, but the user did not click on any of the Answers. Consider building Answers and Liveboards that better answer these questions, or empower these users to build their own Answers and Liveboards by searching your data.
What results users are clicking on
This chart describes what search results users are clicking on against each query. The chart contains the top 10 queries from the last 30 days.
Position at which users are clicking
Describes where in the list of search results users are clicking, indicating how easily users find Answers. The lower the click position, the better. A lower click position means users are able to find Answers easily and high up on the list of search results. "0" means users are finding useful results in autocomplete suggestions, that is, before they could even search.
Worst click position by any user against search queries
Indicates when users have to browse many Answers before finding the right one. This data is from the last 30 days. Consider building Answers and Liveboards for these queries.
Top results users are clicking on
This visualization lists the top search results that users found useful in the last 30 days. You can filter this visualization to see results for a specific query.
Weekly % of search queries on Answers for which no Answers exist
This visualization shows the percentage of searches on existing Answers and Liveboards that had no results, on a weekly basis. The lower the percentage of searches with no results, the better the user experience. If you have a high percentage of queries without results, consider building more Answers and Liveboards, or empower more users to build their own Answers and Liveboards by searching your data.
Weekly searches on Answers
This visualization shows the number of searches on Answers and Liveboards on a weekly basis. You can narrow this down by filtering on query text to see the top results for a specific query.
What results users are finding useful with autocomplete suggestions
Lists the autocomplete query suggestions that users are clicking on. The chart contains the top 10 queries from the last 30 days.
Best practices
You can use the Stats and Trends Liveboard to understand your company’s use of ThoughtSpot in many ways. Here are a few of the most useful ways to interact with this Liveboard.
-
Monitor Adoption:
Keep track of the number of searches on existing Answers and Liveboards in the last 7 days, and on the number of searches on Answers on a weekly basis. -
View what’s trending in your organization:
Users' search queries reflect what information is important to them. To understand what data users currently find valuable, view Top search queries on existing Answers, which has data from the last 30 days.You can also see which queries had no satisfactory Answer for the user, based on the click position and the count of queries with either no results. Consider building Answers and Liveboards that satisfy these queries, or renaming existing objects to match what search terms users use.
-
Determine what content you should create:
Use this Liveboard to determine what Answers and Liveboards you should create for your users. View Top search queries with zero results and Top search queries where the user did not click on any result. If a query has zero results, you have no content for this query. Consider building Answers and Liveboards that satisfy it. If a user does not click on any results, you may have content for this query, but it may not be discoverable. Consider renaming existing objects to match what search terms users use. -
Monitor how users are finding content you created:
As a content creator, you may want to see which search queries result in users clicking on Answers and Liveboards you created. In Top search queries on existing Answers, click Explore. Filter by Result title, specifying your content’s title(s). This filter provides a list of the top search queries that resulted in users clicking on your content, in the last 30 days. Use this information to determine how to slightly alter your descriptions or titles to make your content more discoverable. -
Analyze which search results are useful for a specific query:
The Top results users are clicking on visualization lists the top 10 search results users clicked on in the last 30 days. You may want to find this information for a specific query. In Top results users are clicking on, click Explore. Filter by query text, specifying the query text you want to analyze.
Sharing best practices
You can easily share this Liveboard with non-admins. Refer to Share Liveboards. However, keep in mind that this Liveboard has sensitive data. You can see what all your users are searching. You cannot see what a specific user is searching, but generic information may still be sensitive. Exercise caution when sharing this Liveboard with non-admins.


