Edit the layout of a Liveboard
Editing the layout of a Liveboard lets you snap visualizations into place and change the visualization size.
Visualizations within a Liveboard are easy to move around and snap into place on a relative flow layout. This helps keep the layout of your Liveboard neat and organized.
Your Liveboard layout reacts to your browser width and resolution. If you decrease your browser width or resolution, a horizontal scroll bar appears at the lower edge of your screen.
Reorder the visualizations
You can reorder the visualizations in a Liveboard by dragging and dropping them in Edit mode. To change the visualization layout, follow these steps:
-
Go to the Insights tab and select Liveboards.
-
Navigate to the Liveboard you would like to edit.
-
Select the Edit button at the upper right of the Liveboard. If this button is grayed out, you do not have edit privileges for the Liveboard. To resolve this, contact your administrator or the creator of the Liveboard.
-
Select the bar that appears at the top of any visualization when you hover over it. This allows you to drag and drop your visualizations to new positions in the Liveboard.
-
Select Save in the top menu bar.
Move a visualization to a different tab
If your Liveboard has multiple tabs, you can move the visualizations between tabs. To move visualizations to new tabs, follow these steps:
-
Select the Edit button at the upper right of the Liveboard.
-
Select the More menu
 for the visualization you would like to move to another tab.
 -
Select Move to tab. This option is not available if the Liveboard has only one tab, or if the Liveboard has no tabs.
-
Select the tab to move the visualization to from the list of tabs in the Liveboard.
-
Select Move.
-
Select Save in the top menu.
Change the size of a visualization
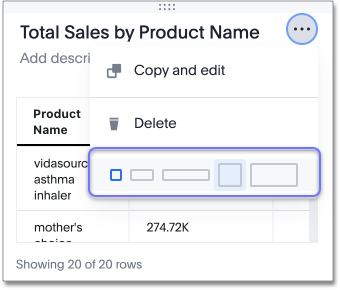
You can customize your Liveboard visualizations to be any size. You can also use the size picker at the bottom of a visualization’s More menu ![]() in edit mode to choose between predetermined sizes for each visualization. All visualizations have 5 predetermined size options, in addition to the custom size option.
To change the size of a visualization with custom tile sizes, follow these steps:
in edit mode to choose between predetermined sizes for each visualization. All visualizations have 5 predetermined size options, in addition to the custom size option.
To change the size of a visualization with custom tile sizes, follow these steps:
-
Navigate to the Liveboard you would like to edit.
-
Select the Edit button at the upper right of the Liveboard. If this button is grayed out, you do not have edit privileges for the Liveboard. To resolve this, contact your administrator or the creator of the Liveboard.
-
Select the size changing icon in the lower-right corner of any visualization, and drag the visualization to the correct size using your mouse. Alternatively, use the 5 predetermined sizes, by selecting the visualization’s More menu
. The last item in the More menu shows different possible sizes, with the current size selected.Custom size:
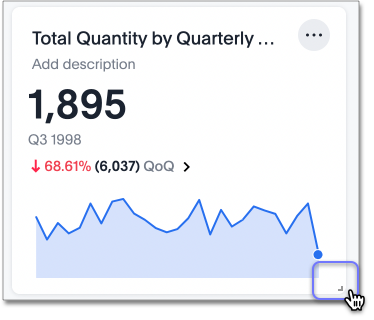
Predetermined sizes:
-
Select Save in the top menu bar.
Delete a visualization from your Liveboard
To delete a visualization:
-
Navigate to the Liveboard that contains the visualization you would like to delete.
-
Select the Edit button at the upper right of the Liveboard. If this button is grayed out, you do not have edit privileges for the Liveboard. To resolve this, contact your administrator or the creator of the Liveboard.
-
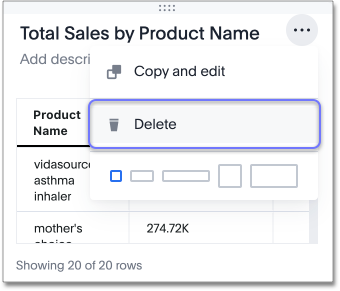
Select the More menu icon
for the visualization you would like to delete.ThoughtSpot displays the dropdown menu.
-
Select Delete.
-
Select Save in the top menu bar.
Make a copy of a visualization from your Liveboard
You may see a visualization that you would like to edit or filter, without editing or filtering the Liveboard. To do this, you can make a copy of a visualization. The copy you create takes into account the Liveboard filters that apply to the visualization.
To create a copy of a visualization and edit it, follow these steps:
-
Navigate to the Liveboard that contains the visualization you would like to copy and edit.
-
In the upper-right corner of the visualization you would like to edit, select the More icon
. -
Select Make a copy. Note that this option is only available in View mode.
A copy of the Answer that created the visualization opens in a new tab, with “Copy of” added to the beginning of the title.
-
Make any changes you want to the visualization.
-
Click the More icon
and select Save.The Save Answer dialog appears.
-
Change the name and description, as needed, and select Save answer.
When you navigate back to the Answers page, your edited Answer appears in the list.
Liveboard tabs
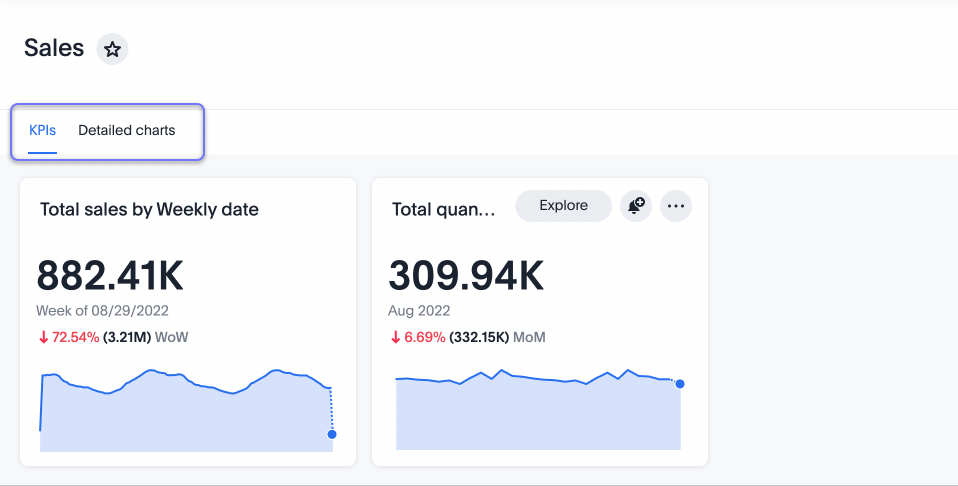
You may want to separate your Liveboard into multiple tabs, grouping certain visualizations together in each tab. For example, you may have a Sales Liveboard that contains top-level KPIs and more detailed charts. You can create a tab for the top-level KPIs for executives to view, and a tab for the more detailed charts that managers need to monitor. To add tabs, select the Edit button at the upper right of the Liveboard, and select + Add tab in the top menu.
To learn more about Liveboard tabs, refer to Liveboard tabs.
Other Liveboard edits
Other Liveboard actions include actions you normally perform on your search as well as actions that you can only perform on a Liveboard.
These actions appear under the More menu icon ![]() for the Liveboard, in view or edit mode, or under the More menu icon
for the Liveboard, in view or edit mode, or under the More menu icon ![]() for a visualization, in view or edit mode.
for a visualization, in view or edit mode.
For example, in View mode for a Liveboard, the Liveboard more menu allows you to rename the Liveboard, manage Liveboard schedules, download the Liveboard as a PDF, make a copy of the Liveboard, and so on. The Rename option also allows you to edit the object description. In Edit mode, the Liveboard more menu only allows you to delete the Liveboard.
In View mode, the visualization more menu allows you to rename the visualization, download it, analyze it with SpotIQ, make a copy of the visualization, and so on. The Rename option also allows you to edit the object description. In Edit mode, the visualization more menu only allows you to delete the visualization or change its size.


