AI Highlights
AI Highlights provides you with quick insights on how top metrics changed in your Liveboard, helping you to focus on the changes that are most important to you and get insights faster.
| To enable AI Highlights, you must enable KPI anomalies. |
To use AI Highlights, do the following:
-
Go to the Insights tab.
-
Select Liveboards.
-
Click a Liveboard you want to view highlights for.
-
To view highlights for that Liveboard, click the AI Highlights button
 , in the upper right.
Highlights are typically generated in less than 30 seconds.
You can run AI Highlights on individual tabs in your Liveboard. Just switch to a different Liveboard tab, and click the AI Highlights button to generate highlights for the selected tab. 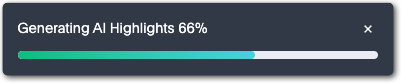
-
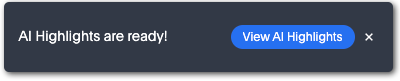
When the highlights are ready, click View AI Highlights.
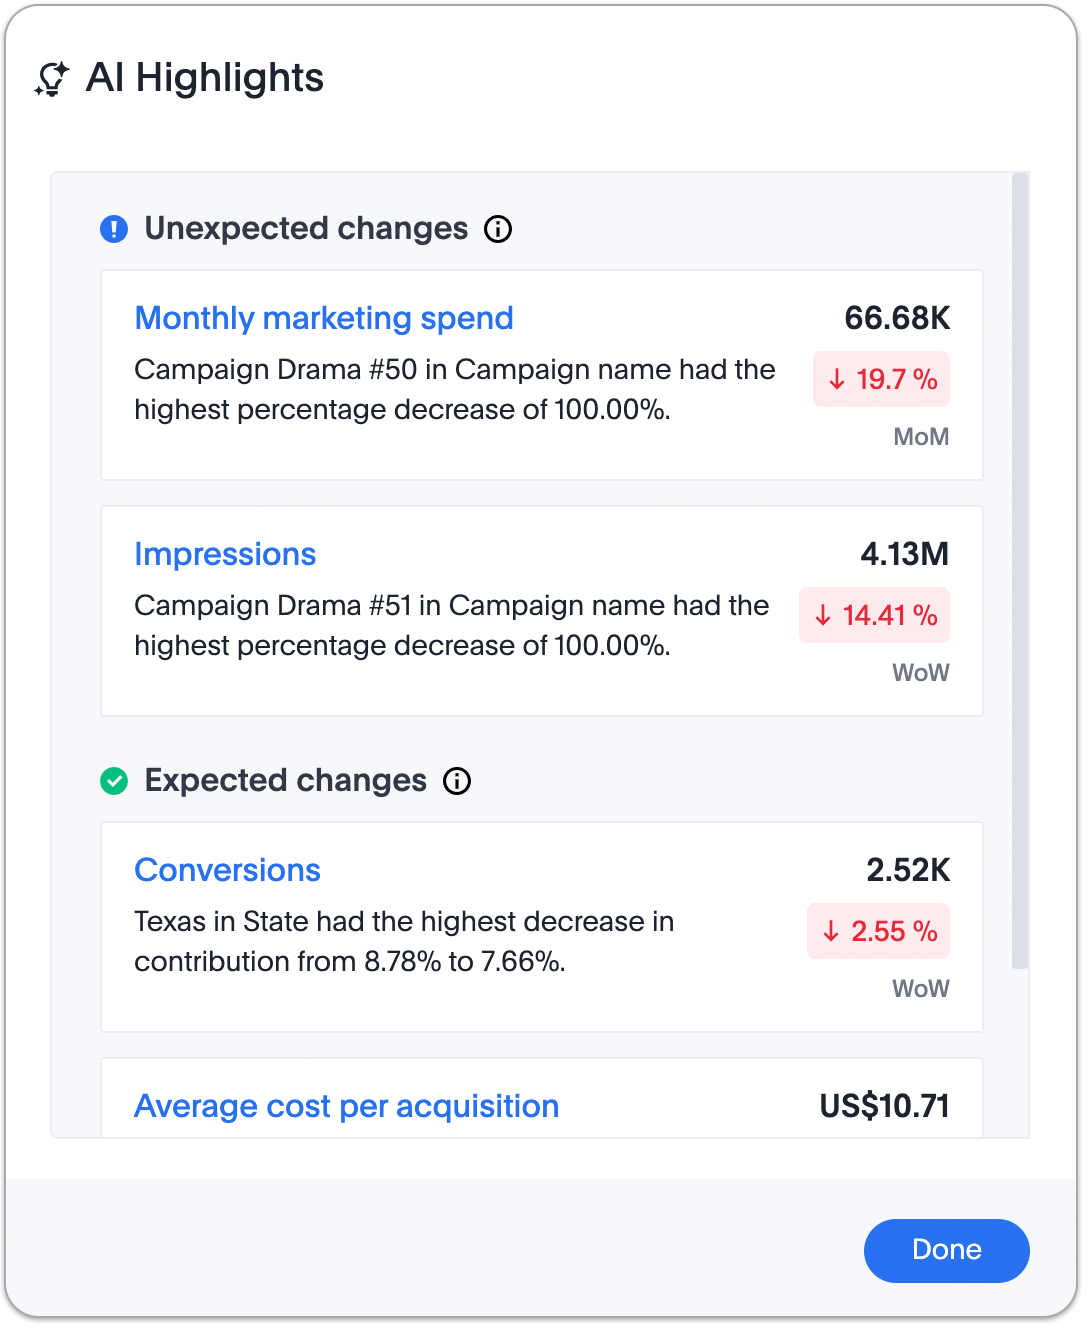
The AI Highlights window opens and displays a summary of the changes in your KPIs. The information is organized into expected and unexpected changes based on the confidence band that’s generated using ThoughtSpot’s anomaly detection engine. If your KPI value goes outside the bounds, it’s classified as an unexpected change. If it doesn’t, it’s classified as an expected change.
-
To get more detail about a KPI change, click the card associated with the change, and the window expands to provide more information.
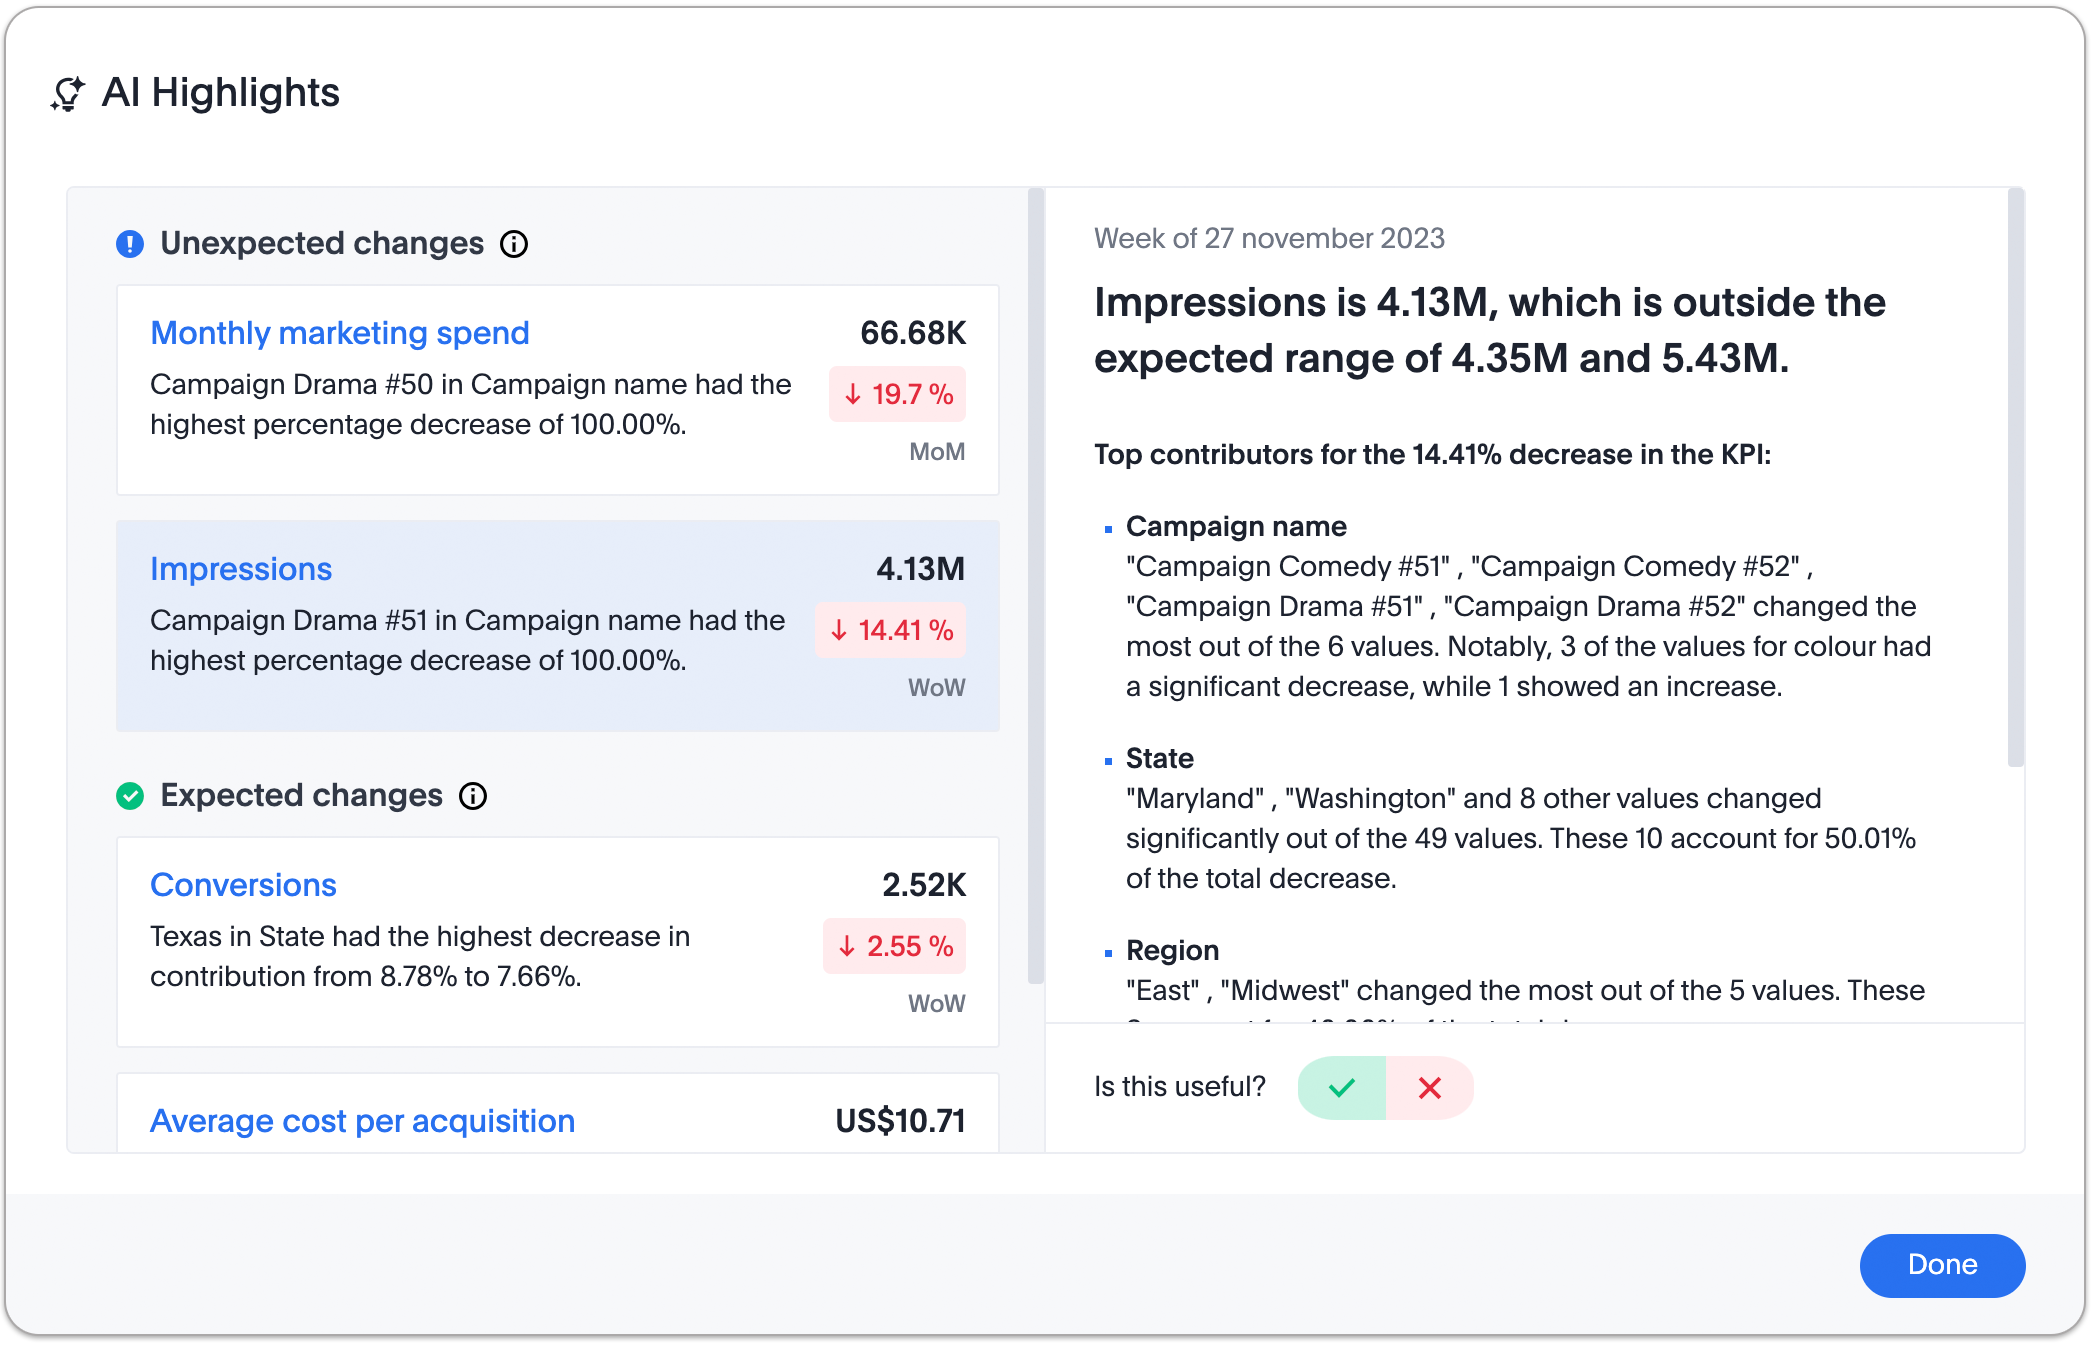
At the bottom of the expanded AI Highlights window, you can let ThoughtSpot know if the information was useful.
How to get the most out of AI Highlights
-
Ensure you have at least five time-series KPI charts on the Liveboard tab for which you are trying to generate highlights.
-
AI Highlights uses SpotIQ’s change analysis feature to generate the top change contributor’s insights. To get insights for only relevant attributes, customize the attribute columns using the change analysis feature.
-
You can customize and save attribute columns at the KPI level, so the creator of the Answer or an admin can apply the attributes for all users.
How AI Highlights are generated
AI Highlights are calculated for the first five time-series KPIs on a particular Liveboard tab. Each tab gets its own summary.
| You must add time-series KPIs to your Liveboard to get AI highlights. |
ThoughtSpot runs the following analyses on the top five identified KPIs:
-
The KPIs are organized into expected and unexpected changes based on the confidence band that’s generated using ThoughtSpot’s anomaly detection engine. If your KPI value goes outside the bounds, it’s classified as an unexpected change; otherwise it’s classified as an expected change.
-
Each KPI card also has an interesting insight about the change contributors that comes from our change analysis feature.
This insight may not highlight the top change contributor. To identify the top change contributor, click the card to expand the window. -
Clicking the KPI card reveals a detailed natural language summary of the change, and the change contributors for the selected KPI.
-
ThoughtSpot leverages the anomaly detection engine to identify the expected bounds that are communicated on the header of the right side panel and the Change contribution for the KPI is powered by ThoughtSpot’s Change analysis.