Heatmap charts
Heatmap charts are similar to treemap charts: they both use a similar system of color-coding to represent data values. However, the heatmap chart does not use size to measure data, and instead requires an additional attribute.
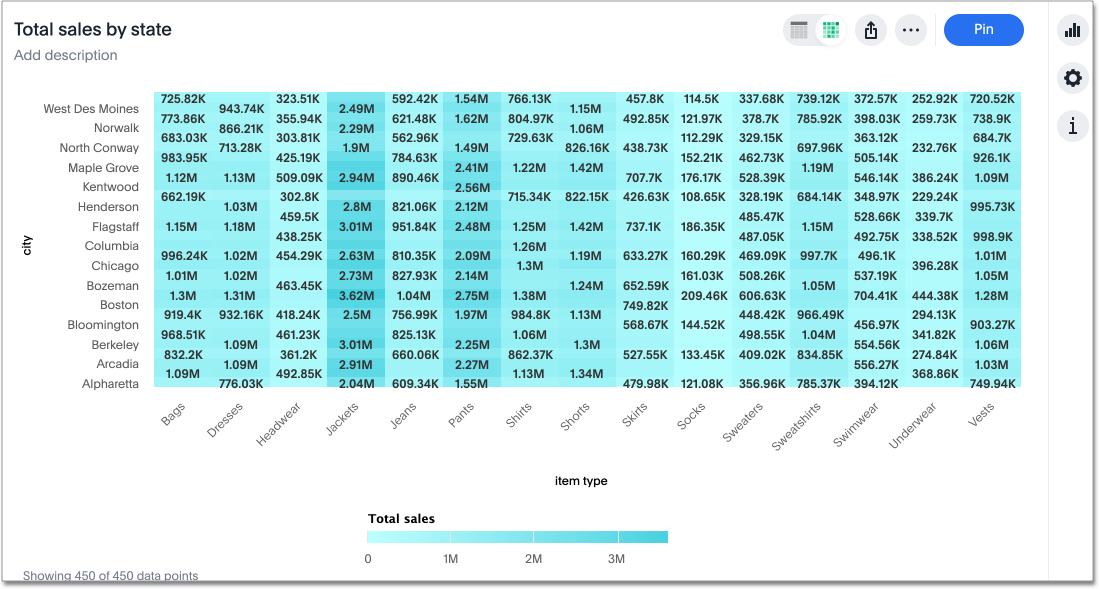
The value of each cell depends on the measure you choose under Edit chart configuration.
Change heatmap color
By default, the heatmap color is teal in various shades. You can change the heatmap color under chart configuration. To change the basic color the heatmap uses, follow these steps:
-
Navigate to any heatmap chart that you have edit privileges for.
-
Select the chart configuration icon
 on the left side of your screen.
 -
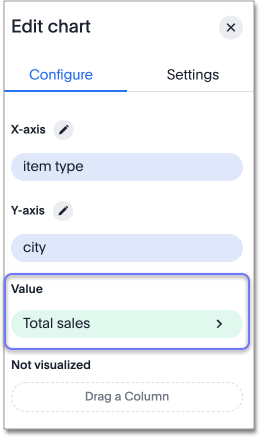
Select the chip for the measure under Value.
-
Click the Color dropdown menu, and select one of the options in the color palette.
Modify data labels
By default, heatmaps have data labels enabled for every value. To disable data labels for heatmaps, follow these steps:
-
Navigate to the heatmap you would like to disable data labels for.
-
Select the edit chart configuration
icon in the upper right of your screen. -
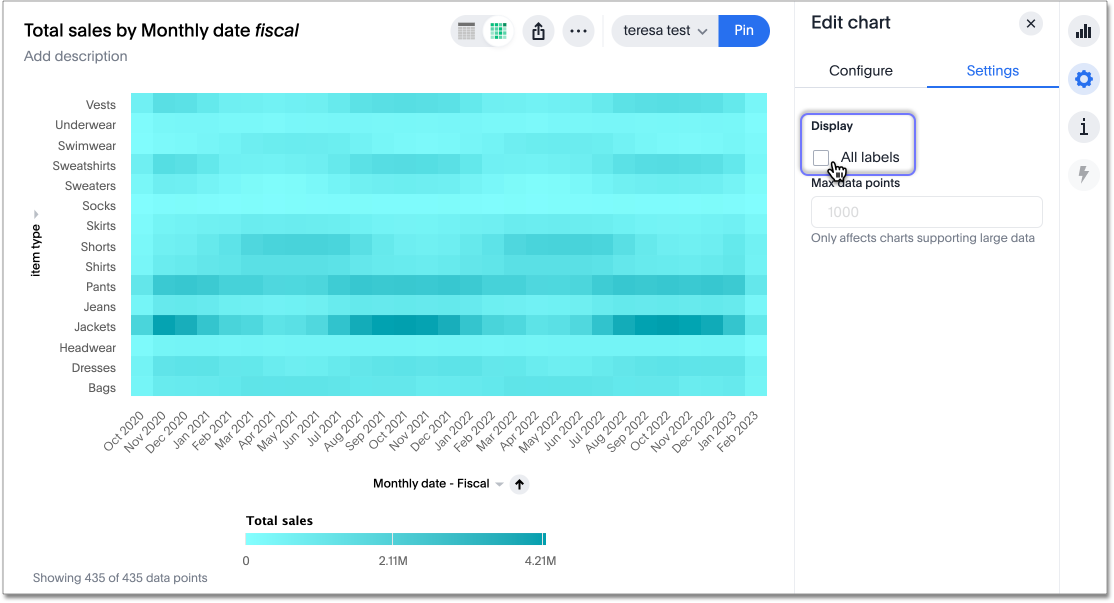
The Edit chart panel opens. Select the Settings tab.
-
Select the All labels option. This enables and disables data labels.
Change chart gradient
You can now choose multiple colors to define a gradient in charts that support gradients — geo heatmap, geo area, heatmap, and treemap charts. You can control the low, mid, and high values, and numerical value points to customize the gradient.
To define the gradient in a geo heatmap, geo area, heatmap, or treemap chart, follow these steps:
-
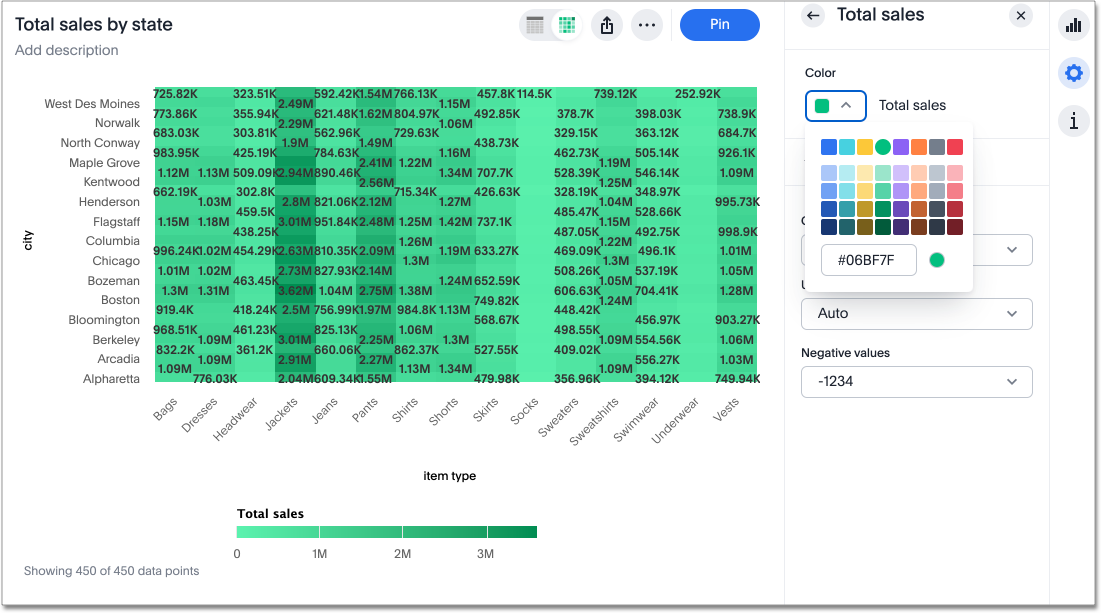
Open your chart, click the gear icon, and select the measure tile under Value. In a search by sales, item type, and city, the value would be sales.
-
Select Edit under Gradient.
-
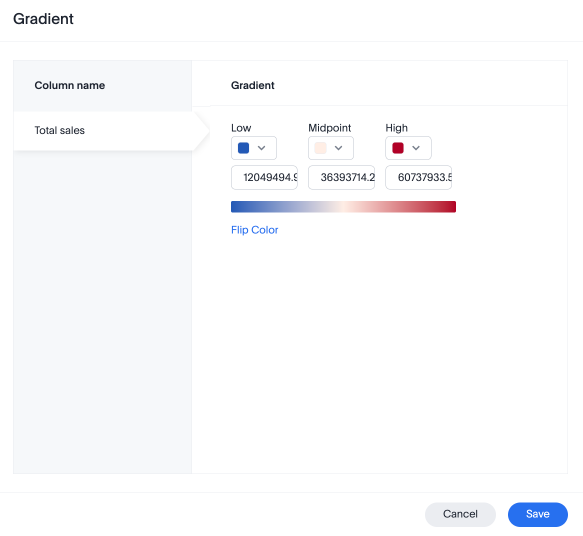
In the Gradient pop-up, define the colors for the Low, Midpoint, and High values using the color selector dropdowns.
-
In the text boxes below the color selectors, you can define the low, midpoint, and high points numerically. You can define the low point, high point and midpoint as a narrow range if you would rather only see gradients for the top values of your measure.
-
(Optional) Select Flip Color to switch the high and low value colors.
-
Select Save.