Custom charts
Custom charts give you the ability to create chart types to visualize your data, by using any charting library created outside of ThoughtSpot. You can also access ready-to-use charts created by partners.
ThoughtSpot’s built-in charting library, Muze, powers a rich set of native chart types — including bar, line, area, scatter, pie, donut, gantt, waterfall, trellis, and more — designed to handle the majority of analytical visualization needs directly out of the box.
When you need a visualization beyond what’s built in, ThoughtSpot gives you several ways to build it:
-
Muze Studio — A code execution sandbox built into ThoughtSpot, where you can write Muze code, plain JavaScript/CSS/HTML, or use third-party libraries like Chart.js or D3.js.
-
ThoughtSpot Charts SDK — For developers who build and host fully custom chart applications.
-
Partner charts — Ready-to-use chart collections from ThoughtSpot partners such as Vitara.
All custom charts support ThoughtSpot-native features including drill-down, Explore, and conditional formatting.
To enable the custom charts feature, contact your administrator.
Muze Studio
Muze Studio is a code execution sandbox built into ThoughtSpot. Unlike native Muze charts, Muze Studio gives you a full editor environment where you can bring any chart type to life — using Muze code, plain web code, or any browser-compatible charting library. It is the recommended option for custom chart development because it is:
-
Built-in: Available directly in the ThoughtSpot interface — no external hosting required.
-
Flexible: Supports Muze syntax, custom JS/CSS/HTML, and third-party charting libraries.
-
Performant: Optimized for ThoughtSpot’s data model for high-performance rendering.
-
Natively integrated: Supports drill-down, Explore, and conditional formatting.
For step-by-step instructions, see Creating charts with Muze Studio.
Other options for custom charts
-
ThoughtSpot Charts SDK: Developers can create custom charts in JavaScript using charting libraries such as Highcharts. For more information, see the ThoughtSpot Charts SDK documentation.
-
Vitara Charts: Access a library of custom charts installable in seconds with ThoughtSpot partner Vitara. Vitara requires a separate subscription. For more information, see VitaraCharts for ThoughtSpot.
-
ThoughtSpot Professional Services: ThoughtSpot professional services can create custom charts for your organization. For more information, contact ThoughtSpot support.
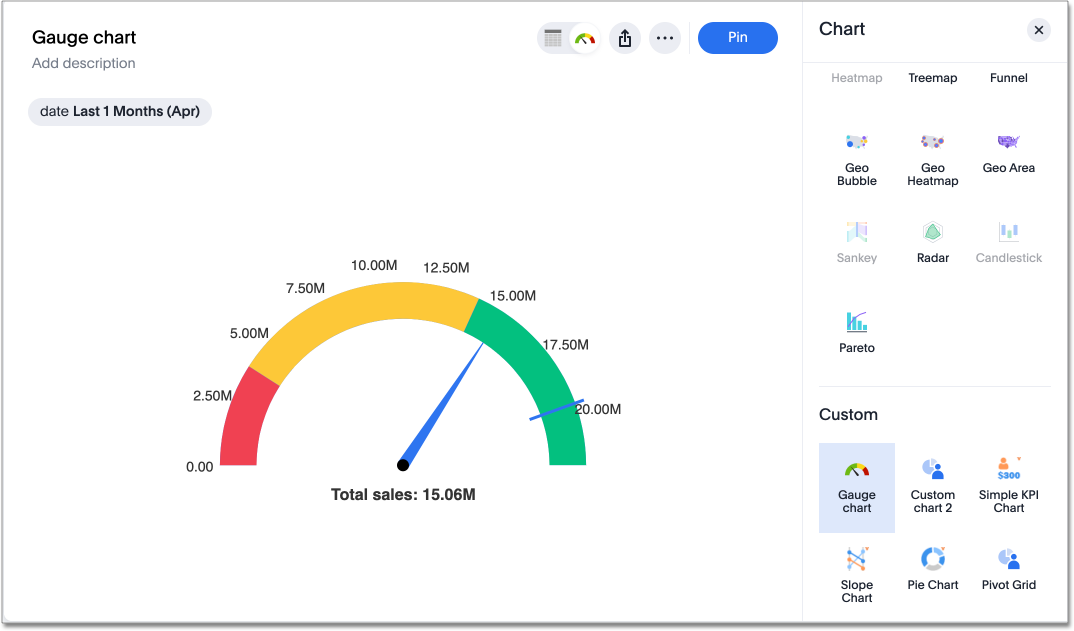
Using custom charts
To use a custom chart:
-
Click the Change visualization button
 .
. -
Below the list of default charts, select a custom chart.
Administering custom charts
A ThoughtSpot administrator can add, edit, and delete custom charts. Before adding a custom chart, the administrator must add the domains where the chart and chart icon are hosted to the permitted iFrame and CSP img-src domains list in ThoughtSpot. Without this step, the custom chart cannot load.
Add domains to the permitted iFrame and CSP img-src domains
-
Navigate to Develop.
-
Navigate to All Orgs > Security settings.
-
Click Edit.
-
In the Permitted iFrame domains field, enter the domain where the custom chart is hosted.
-
In the CSP img-src domains field, enter the domain where the chart icon is hosted.
-
Click Save Changes.
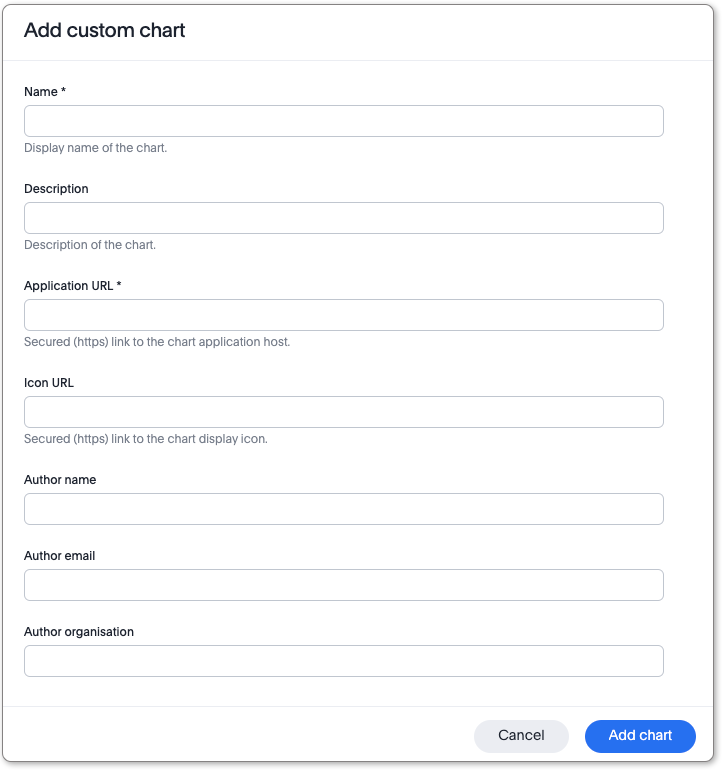
Add a custom chart
-
Navigate to Admin settings > Chart customization under Application settings.
-
Select the Custom charts tab.
-
Click Add chart.
The Add custom chart window appears.
-
Enter the following details:
Field Required Description Name
Yes
Display name for the chart in the chart selector
Description
No
Short description visible to users
Application URL
Yes
URL where the chart application is hosted
Icon URL
No
URL for the chart icon displayed in the selector
Author name
No
Name of the chart creator
Author email
No
Contact email for the chart creator
Author organization
No
Organization that created the chart
-
Click Add chart.
The chart appears on the Custom charts page and is available in the chart type selector.