Stacked area charts
The stacked area chart is an area chart with an attribute in the legend, which divides the area into layers. Note that you can only use an attribute to slice with color and create layers.
Stacked area charts show the relative contribution to the accumulated total of a measure over time.
Stacked area charts plot the y-axis as a percentage by default.
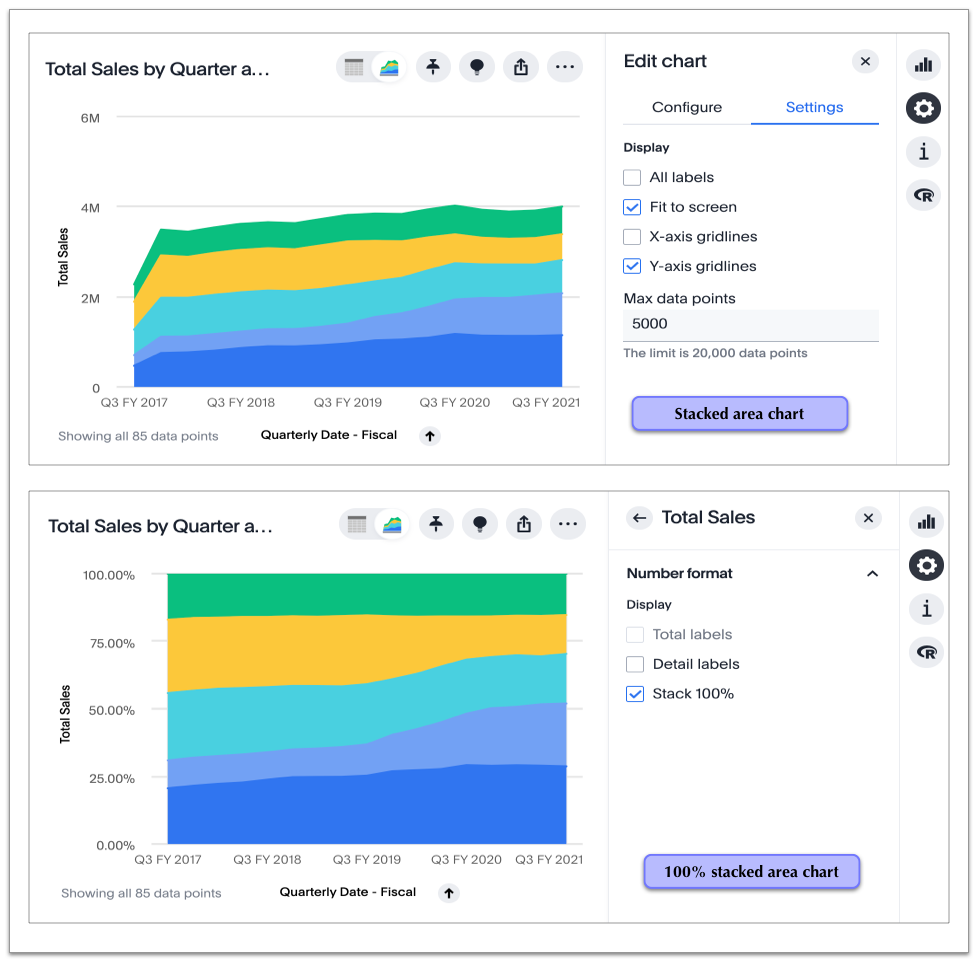
You can also view your chart with the y-axis set to 100%.
Click the Chart configuration icon ![]() and select the y-axis measure.
Under Number format, toggle Stack 100% on or off.
You can also select the attribute you are using to slice with color to find the Stack 100% option.
and select the y-axis measure.
Under Number format, toggle Stack 100% on or off.
You can also select the attribute you are using to slice with color to find the Stack 100% option.
Your search needs at least two attributes and one measure to be represented as a stacked area chart.