Snowflake Query Profile SpotApp
SpotApps are ThoughtSpot’s out-of-the-box solution templates built for specific use cases and data sources. They are built on ThoughtSpot Modeling Language (TML) Blocks, which are pre-built pieces of code that are easy to download and implement directly from the product.
The Snowflake Query Profile SpotApp mimics the Snowflake data model. When you deploy it, ThoughtSpot creates several Worksheets, Answers, and Liveboards, based on your Snowflake data in your cloud data warehouse.
This is a sample Liveboard, created after you deploy the Snowflake Query Profile SpotApp:
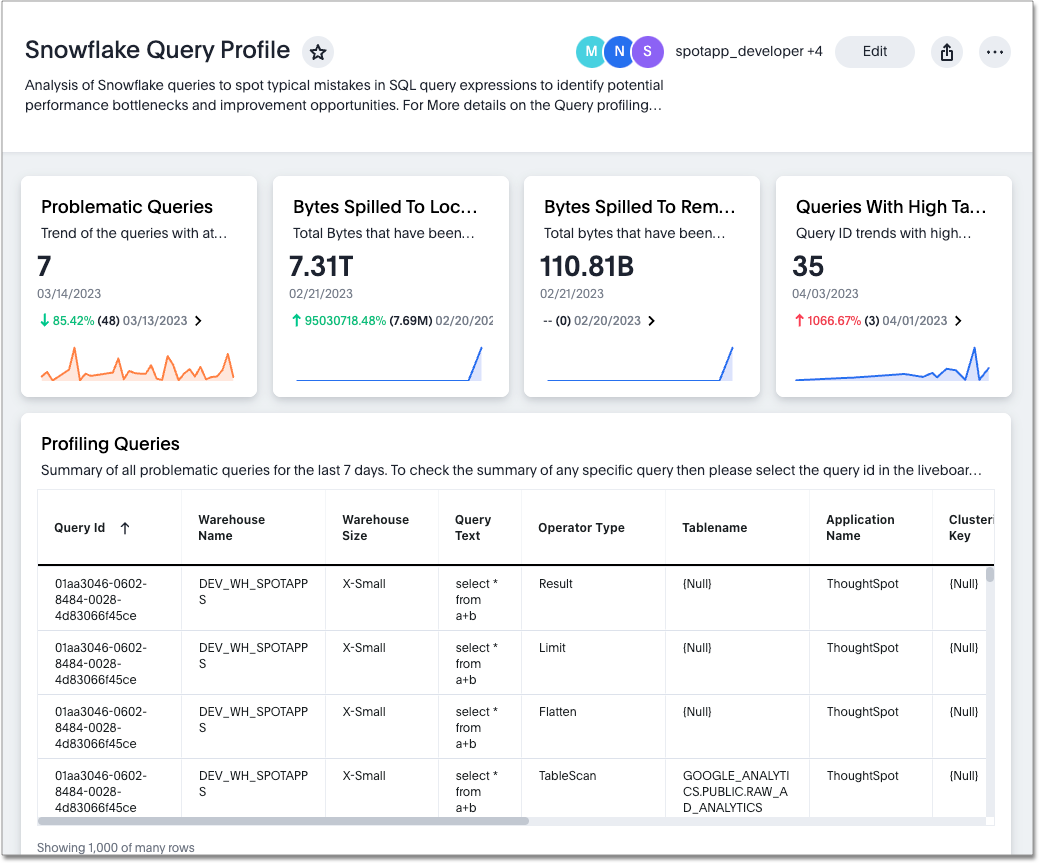
Use the Snowflake Query Profile SpotApp to analyze Snowflake query data to understand execution time better and pinpoint key areas for query optimization.
Prerequisites
Before you can deploy the Snowflake Query Profile SpotApp, you must complete the following prerequisites:
-
Review the required tables and columns for the SpotApp.
-
Ensure that your columns match the required column type listed in the schema for your SpotApp.
-
Sync all tables and columns from Snowflake to your cloud data warehouse. You can sync only the required tables and columns, but ThoughtSpot recommends syncing all tables and columns from Snowflake to your CDW. The columns can be Snowflake’s out-of-the-box columns, or any custom columns that you are using instead of the out-of-the-box columns.
If you are using an ETL/ELT tool or working with another team in your organization to move data, our recommendation is that you sync all columns from the tables listed in the SpotApp. -
Obtain credentials and SYSADMIN privileges to connect to your Snowflake environment. Your Snowflake environment must contain the data you would like ThoughtSpot to use to create Answers, Liveboards, and Worksheets. Refer to the connection reference for Snowflake for information about required credentials.
-
The connection name for each new SpotApp must be unique.
-
ACCOUNTADMINaccess to Snowflake. -
Access to the SNOWFLAKE database in your Snowflake environment.
-
Access to the following Snowflake tables in your Snowflake environment. Refer to Snowflake Query Profile SpotApp schema for more details.
-
QUERY_OPERATOR_STATS_CACHE
-
-
Run the required SQL commands in your cloud data warehouse. Refer to Run SQL commands.
Run SQL commands
-
Create an empty table to insert the query operator stats for each query id.
Please replace <database_name>.<schema_name> with the database and schema where you want to create the query stats metadata table. Open the dropdown menu to view the schema.
Create or replace table <database_name>.<schema_name>.query_operator_stats_cache ( QUERY_ID VARCHAR(16777216), QUERY_TEXT VARCHAR(16777216), DATABASE_NAME VARCHAR(16777216), SCHEMA_NAME VARCHAR(16777216), WAREHOUSE_NAME VARCHAR(16777216), WAREHOUSE_SIZE VARCHAR(16777216), EXECUTION_STATUS VARCHAR(16777216), CLIENT_APPLICATION_ID VARCHAR(16777216), APPLICATION_NAME VARCHAR(16777216), START_TIME TIMESTAMP_LTZ(6), END_TIME TIMESTAMP_LTZ(6), USER_NAME VARCHAR(16777216), STEP_ID NUMBER(38,0), OPERATOR_ID NUMBER(38,0), PARENT_OPERATOR_ID NUMBER(38,0), OPERATOR_TYPE VARCHAR(16777216), OPERATOR_STATISTICS VARIANT, EXECUTION_TIME_BREAKDOWN VARIANT, OPERATOR_ATTRIBUTES VARIANT, TABLENAME VARCHAR(16777216), TABLE_NCOLS NUMBER(9,0), OPERATOR_EXECUTION_TIME FLOAT, LOCAL_DISK_IO FLOAT, PROCESSING FLOAT, SYNCHRONIZATION FLOAT, BYTES_SCANNED NUMBER(38,0), PERCENTAGE_SCANNED_FROM_CACHE FLOAT, NETWORK_BYTES NUMBER(38,0), OUTPUT_ROWS VARIANT, INPUT_ROWS VARIANT, ROW_MULTIPLE FLOAT, BYTES_SPILLED_LOCAL_STORAGE VARIANT, BYTES_SPILLED_REMOTE_STORAGE VARIANT, PARTITIONS_SCANNED VARIANT, PARTITIONS_TOTAL VARIANT, PARTITION_SCAN_RATIO FLOAT, EXPLODING_JOIN VARCHAR(16777216), UNION_WITHOUT_ALL VARCHAR(16777216), QUERIES_TOO_LARGE_MEMORY VARCHAR(16777216), INEFFICIENT_PRUNING_FLAG VARCHAR(16777216), ELAPSED_SECONDS NUMBER(38,6), CLUSTERING_KEY VARCHAR(16777216)); -
The below task captures the id of each query which ran for more than 2 minutes and scanned more than 1 MB of data in the last 14 days. The task is scheduled to run every 60 minutes.
Query Operator stats are available for all queries that were run in the last 14 days. Open the dropdown menu to view the task.
create or replace task query_session_task warehouse = <warehouse_names> SCHEDULE = '60 minute' AS create or replace table <database_name>.<schema_name>.query_sessions as select QUERY_ID FROM SNOWFLAKE.ACCOUNT_USAGE.QUERY_HISTORY q INNER JOIN SNOWFLAKE.ACCOUNT_USAGE.SESSIONS s ON q.SESSION_ID = s.SESSION_ID where bytes_scanned > 1024 * 1024 and total_elapsed_time / 1000 > 120 and execution_status = 'SUCCESS' and end_time >= CURRENT_DATE - INTERVAL '13 DAY' AND query_type = 'SELECT' AND warehouse_name IS NOT NULL order by start_time desc; -
The below task captures the query operator stats for the query id’s collected from the above step. The task is scheduled to run every 65 minutes.
Open the dropdown menu to view the task.
CREATE or replace TASK query_stats_task warehouse = <warehouse_names> SCHEDULE = '65 minute' AS execute immediate $$ declare query_id string; query_tag string; qid int; session_id int; c1 cursor for select query_id from <database_name>.<schema_name>.query_sessions where query_id not in (select query_id from <database_name>.<schema_name>.query_operator_stats_cache); begin open c1; for record in c1 do fetch c1 into query_id; insert into <database_name>.<schema_name>.query_operator_stats_cache with query_stats as ( select q_h.QUERY_ID, q_h.QUERY_TEXT, q_h.DATABASE_NAME, q_h.SCHEMA_NAME, q_h.WAREHOUSE_NAME, q_h.WAREHOUSE_SIZE, q_h.EXECUTION_STATUS, q_h.SESSION_ID, q_h.START_TIME, q_h.END_TIME, q_h.USER_NAME, q_p.STEP_ID, q_p.OPERATOR_ID, q_p.PARENT_OPERATORS, q_p.OPERATOR_TYPE, q_p.OPERATOR_STATISTICS, q_p.EXECUTION_TIME_BREAKDOWN, q_p.OPERATOR_ATTRIBUTES, q_p.operator_attributes:table_name::string tablename, array_size(q_p.operator_attributes:columns) table_ncols, q_p.EXECUTION_TIME_BREAKDOWN:overall_percentage::float as OPERATOR_EXECUTION_TIME, q_p.execution_time_breakdown:local_disk_io::float local_disk_io, q_p.execution_time_breakdown:processing::float processing, q_p.execution_time_breakdown:synchronization::float synchronization, q_p.operator_statistics:io:bytes_scanned::int bytes_scanned, q_p.operator_statistics:io:percentage_scanned_from_cache::float percentage_scanned_from_cache, q_p.operator_statistics:network:network_bytes::int network_bytes, q_p.OPERATOR_STATISTICS:output_rows as output_rows, q_p.OPERATOR_STATISTICS:input_rows as input_rows, div0(q_p.operator_statistics:output_rows , operator_statistics:input_rows) as row_multiple, q_p.OPERATOR_STATISTICS:spilling:bytes_spilled_local_storage as bytes_spilled_local_storage, q_p.OPERATOR_STATISTICS:spilling:bytes_spilled_remote_storage as bytes_spilled_remote_storage, q_p.OPERATOR_STATISTICS:pruning:partitions_scanned as partitions_scanned, q_p.OPERATOR_STATISTICS:pruning:partitions_total as partitions_total, div0(q_p.OPERATOR_STATISTICS:pruning:partitions_scanned,OPERATOR_STATISTICS:pruning:partitions_total) as partition_scan_ratio, case when div0(q_p.operator_statistics:output_rows , operator_statistics:input_rows) > 1 then 1 else 0 end as EXPLODING_JOIN, case when OPERATOR_TYPE = 'UnionAll' and lag(OPERATOR_TYPE) over (ORDER BY OPERATOR_ID) = 'Aggregate' THEN 1 ELSE 0 END AS UNION_WITHOUT_ALL, CASE WHEN q_p.OPERATOR_STATISTICS:spilling:bytes_spilled_local_storage>0 OR q_p.OPERATOR_STATISTICS:spilling:bytes_spilled_remote_storage>0 THEN 1 ELSE 0 END AS QUERIES_TOO_LARGE_MEMORY, CASE WHEN div0(q_p.OPERATOR_STATISTICS:pruning:partitions_scanned,OPERATOR_STATISTICS:pruning:partitions_total) >= .8 AND q_p.OPERATOR_STATISTICS:pruning:partitions_total >= 20000 THEN 1 ELSE 0 END AS INEFFICIENT_PRUNING_FLAG, q_h.total_elapsed_time / 1000 as elapsed_seconds from "SNOWFLAKE"."ACCOUNT_USAGE"."QUERY_HISTORY" as q_h, table(get_query_operator_stats(:query_id)) as q_p where q_h.QUERY_ID=(:query_id) order by STEP_ID, OPERATOR_ID ) select QUERY_ID, QUERY_TEXT, DATABASE_NAME, SCHEMA_NAME, WAREHOUSE_NAME, WAREHOUSE_SIZE, EXECUTION_STATUS, CLIENT_APPLICATION_ID, PARSE_JSON(CLIENT_ENVIRONMENT):APPLICATION::string as APPLICATION_NAME, START_TIME, END_TIME, query_stats.USER_NAME, STEP_ID, OPERATOR_ID, cast(PARENT_OPERATORS[0] as number(38,0)) as PARENT_OPERATOR_ID, OPERATOR_TYPE, OPERATOR_STATISTICS, EXECUTION_TIME_BREAKDOWN, OPERATOR_ATTRIBUTES, tablename, table_ncols, OPERATOR_EXECUTION_TIME, local_disk_io, processing, synchronization, bytes_scanned, percentage_scanned_from_cache, network_bytes, output_rows, input_rows, row_multiple, bytes_spilled_local_storage, bytes_spilled_remote_storage, partitions_scanned, partitions_total, partition_scan_ratio, EXPLODING_JOIN, UNION_WITHOUT_ALL, QUERIES_TOO_LARGE_MEMORY, INEFFICIENT_PRUNING_FLAG, elapsed_seconds, CLUSTERING_KEY from query_stats inner join "SNOWFLAKE"."ACCOUNT_USAGE".SESSIONS s on query_stats.SESSION_ID = s.SESSION_ID left join "SNOWFLAKE"."INFORMATION_SCHEMA"."TABLES" t on query_stats.tablename= t.TABLE_CATALOG || '.' || t.TABLE_SCHEMA || '.' || t.TABLE_NAME order by STEP_ID, OPERATOR_ID; end for; return query_id; end $$; -
Execute or resume the tasks created above to start immediately.
-
To run the task immediately:
EXECUTE TASK query_session_task; EXECUTE TASK query_stats_task; -
To run the task at the scheduled interval:
ALTER TASK query_session_task RESUME;
ALTER TASK query_stats_task RESUME;
-
-
The query_operator_stats_cache table data updates on a daily basis. You must set up retention on the table. Use the following command to set up retention for the query_operator_stats_cache table.
ALTER TABLE <database_name>.<schema_name>.query_operator_stats_cache SET DATA_RETENTION_TIME_IN_DAYS=30;The number of days can be set based on your requirements. -
Wait for the tasks created above to run, capturing the query profile stats at the individual query level.
Once the stats are captured, you are ready to deploy the Snowflake Query Profile SpotApp.
Deploy the Snowflake Query Profile SpotApp
After you complete the prerequisites, you are ready to deploy the Snowflake Query Profile SpotApp and begin leveraging its pre-built content.
To deploy the Snowflake Query Profile SpotApp, refer to Deploying SpotApps.
Snowflake Query Profile SpotApp schema
The following table describes the schema for the Snowflake Query Profile SpotApp.
| Table | Column name | Column type | Required column |
|---|---|---|---|
QUERY_OPERATOR_STATS_CACHE |
APPLICATION_NAME |
VARCHAR |
Y |
QUERY_OPERATOR_STATS_CACHE |
BYTES_SCANNED |
INT64 |
Y |
QUERY_OPERATOR_STATS_CACHE |
BYTES_SPILLED_LOCAL_STORAGE |
VARCHAR |
Y |
QUERY_OPERATOR_STATS_CACHE |
BYTES_SPILLED_REMOTE_STORAGE |
VARCHAR |
Y |
QUERY_OPERATOR_STATS_CACHE |
CLIENT_APPLICATION_ID |
VARCHAR |
Y |
QUERY_OPERATOR_STATS_CACHE |
CLUSTERING_KEY |
VARCHAR |
Y |
QUERY_OPERATOR_STATS_CACHE |
DATABASE_NAME |
VARCHAR |
Y |
QUERY_OPERATOR_STATS_CACHE |
ELAPSED_SECONDS |
DOUBLE |
Y |
QUERY_OPERATOR_STATS_CACHE |
END_TIME |
DATE_TIME |
Y |
QUERY_OPERATOR_STATS_CACHE |
EXECUTION_STATUS |
VARCHAR |
Y |
QUERY_OPERATOR_STATS_CACHE |
EXECUTION_TIME_BREAKDOWN |
VARCHAR |
Y |
QUERY_OPERATOR_STATS_CACHE |
EXPLODING_JOIN |
VARCHAR |
Y |
QUERY_OPERATOR_STATS_CACHE |
INEFFICIENT_PRUNING_FLAG |
VARCHAR |
Y |
QUERY_OPERATOR_STATS_CACHE |
INPUT_ROWS |
VARCHAR |
Y |
QUERY_OPERATOR_STATS_CACHE |
LOCAL_DISK_IO |
DOUBLE |
Y |
QUERY_OPERATOR_STATS_CACHE |
NETWORK_BYTES |
INT64 |
Y |
QUERY_OPERATOR_STATS_CACHE |
OPERATOR_ATTRIBUTES |
VARCHAR |
Y |
QUERY_OPERATOR_STATS_CACHE |
OPERATOR_EXECUTION_TIME |
DOUBLE |
Y |
QUERY_OPERATOR_STATS_CACHE |
OPERATOR_ID |
INT64 |
Y |
QUERY_OPERATOR_STATS_CACHE |
OPERATOR_STATISTICS |
VARCHAR |
Y |
QUERY_OPERATOR_STATS_CACHE |
OPERATOR_TYPE |
VARCHAR |
Y |
QUERY_OPERATOR_STATS_CACHE |
OUTPUT_ROWS |
VARCHAR |
Y |
QUERY_OPERATOR_STATS_CACHE |
PARENT_OPERATOR_ID |
INT64 |
Y |
QUERY_OPERATOR_STATS_CACHE |
PARTITION_SCAN_RATIO |
DOUBLE |
Y |
QUERY_OPERATOR_STATS_CACHE |
PARTITIONS_SCANNED |
VARCHAR |
Y |
QUERY_OPERATOR_STATS_CACHE |
PARTITIONS_TOTAL |
VARCHAR |
Y |
QUERY_OPERATOR_STATS_CACHE |
PERCENTAGE_SCANNED_FROM_CACHE |
DOUBLE |
Y |
QUERY_OPERATOR_STATS_CACHE |
PROCESSING |
DOUBLE |
Y |
QUERY_OPERATOR_STATS_CACHE |
QUERIES_TOO_LARGE_MEMORY |
VARCHAR |
Y |
QUERY_OPERATOR_STATS_CACHE |
QUERY_ID |
VARCHAR |
Y |
QUERY_OPERATOR_STATS_CACHE |
QUERY_TEXT |
VARCHAR |
Y |
QUERY_OPERATOR_STATS_CACHE |
ROW_MULTIPLE |
DOUBLE |
Y |
QUERY_OPERATOR_STATS_CACHE |
SCHEMA_NAME |
VARCHAR |
Y |
QUERY_OPERATOR_STATS_CACHE |
START_TIME |
DATE_TIME |
Y |
QUERY_OPERATOR_STATS_CACHE |
STEP_ID |
INT64 |
Y |
QUERY_OPERATOR_STATS_CACHE |
SYNCHRONIZATION |
DOUBLE |
Y |
QUERY_OPERATOR_STATS_CACHE |
TABLENAME |
VARCHAR |
Y |
QUERY_OPERATOR_STATS_CACHE |
TABLE_NCOLS |
INT64 |
Y |
QUERY_OPERATOR_STATS_CACHE |
UNION_WITHOUT_ALL |
VARCHAR |
Y |
QUERY_OPERATOR_STATS_CACHE |
USER_NAME |
VARCHAR |
Y |
QUERY_OPERATOR_STATS_CACHE |
WAREHOUSE_NAME |
VARCHAR |
Y |
QUERY_OPERATOR_STATS_CACHE |
WAREHOUSE_SIZE |
VARCHAR |
Y |


