Selective Liveboard filters
Learn how to specify which Liveboard visualizations a Liveboard filter should apply to.
| Starting in May 2022, ThoughtSpot rebranded pinboards as Liveboards. For backward compatibility, we currently support internal processes and external methods that use the older naming convention. |
When you create or view a Liveboard, you may want to filter the visualizations on the Liveboard, to only see data that is relevant to your role, for example. However, you may not want a filter to apply to every visualization in the Liveboard. For example, the head of sales in North America may want to filter most visualizations to only contain data about sales in North America, but may want to compare her sales to an unfiltered global quarterly sales metric.
You can apply Liveboard filters to specific visualizations from the Configure filters modal.
To learn more about Liveboard filters, refer to Liveboard filters and Linked Liveboard filters.
Configure selective filters
-
Navigate to the Liveboard you would like to filter, or create a new Liveboard.
-
Add filters to the Liveboard. To create filters for visualizations based on one Worksheet, refer to Liveboard filters. To create one filter that filters visualizations based on more than one Worksheet, refer to Linked Liveboard filters.
-
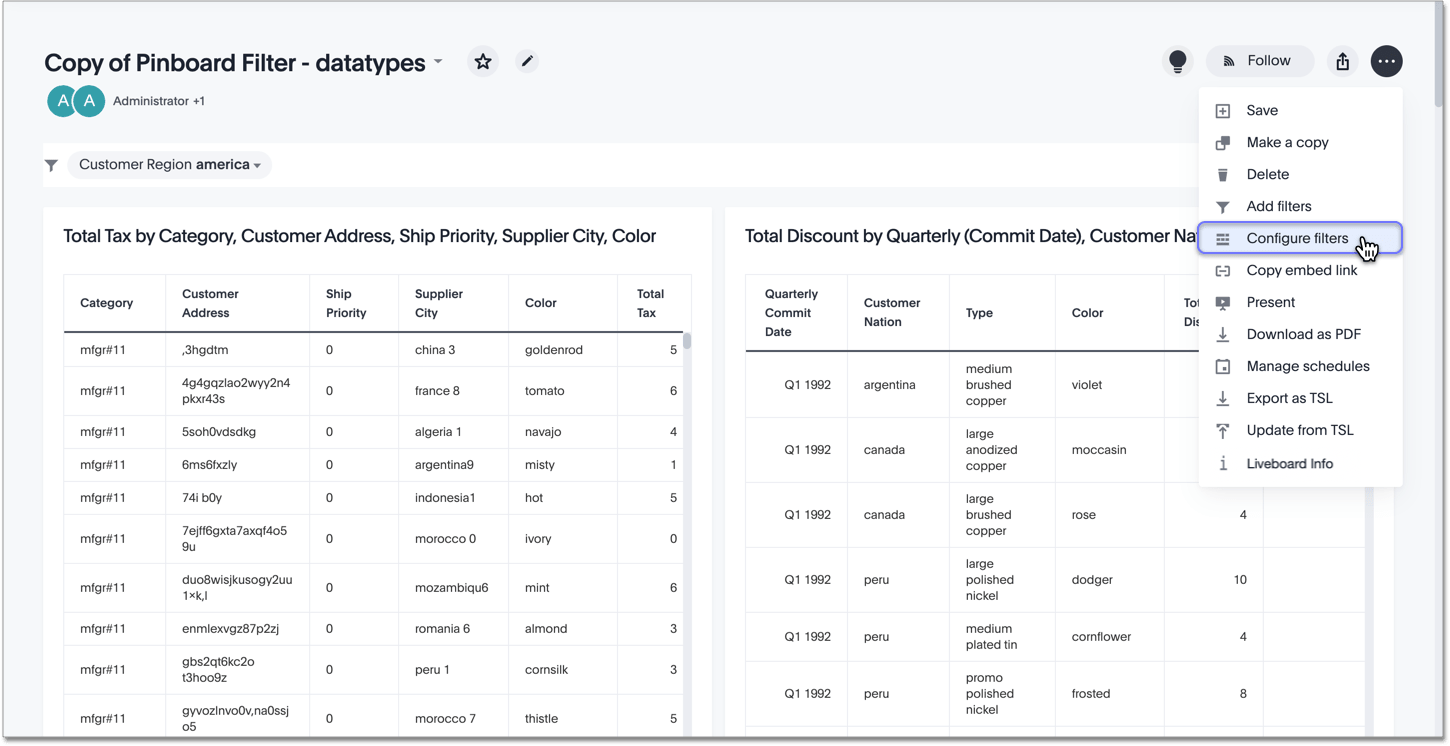
Select the More menu icon
 at the upper right, and select Configure filters.
-
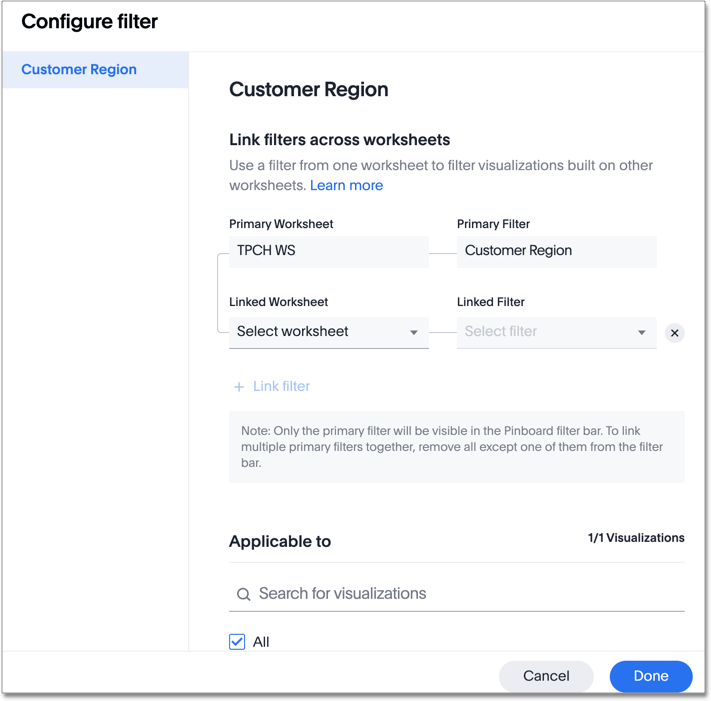
The Configure filter modal appears. The side menu contains every primary filter column for the Liveboard. In this case, there is only one filter: Customer region. So, Customer region is the only column in the side menu. Select the filter you would like to configure from the side menu, if there is more than one filter.

-
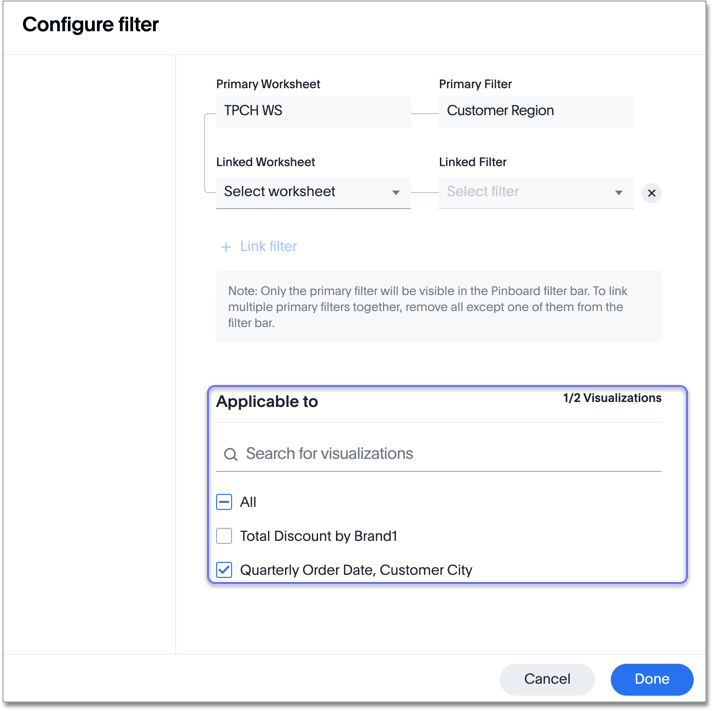
Scroll down to Applicable to. You can select the All option, or only choose certain visualizations. You can also search for a visualization.

-
Select Done. ThoughtSpot applies the filter to the visualization(s) you specified.


