Linked Liveboard filters
You can link columns from multiple worksheets, to create one Liveboard filter for visualizations that come from different worksheets.
| Starting in May 2022, ThoughtSpot rebranded pinboards as Liveboards. For backward compatibility, we currently support internal processes and external methods that use the older naming convention. |
When you create and share a Liveboard, you or other users may want to filter the visualizations on the Liveboard, to only see data that is relevant to your role. The head of customer experience in the North America region may only want to see the data on customers in North America, in a Liveboard that represents global customer data. However, the Liveboard may be built on multiple worksheets: Sales and NPS, for example. To create one filter that filters both visualizations built on the Sales worksheet, and the visualizations built on the NPS worksheet, you can link the worksheet columns, at the Liveboard level.
To filter Liveboards based on one worksheet, see Liveboard filters.
Configure linked filters
To configure linked Liveboard filters, follow these steps. Note that you can link the worksheet columns at the Liveboard level without actually filtering the Liveboard. This is useful if you would like your users to be able to choose their own filters for the Liveboard.
| When you create linked Liveboard filters, you link worksheet columns at the Liveboard level. You do not globally link the worksheet columns. You must create linked filters separately, for each Liveboard. |
-
Navigate to the Liveboard you would like to filter, or create a new Liveboard.
-
First, you must add primary Liveboard filters. If you do not add primary filters, the Configure filters option does not appear in the More menu
 .
. -
To add a primary Liveboard filter, select the More menu icon
at the upper right, and select Add filters. -
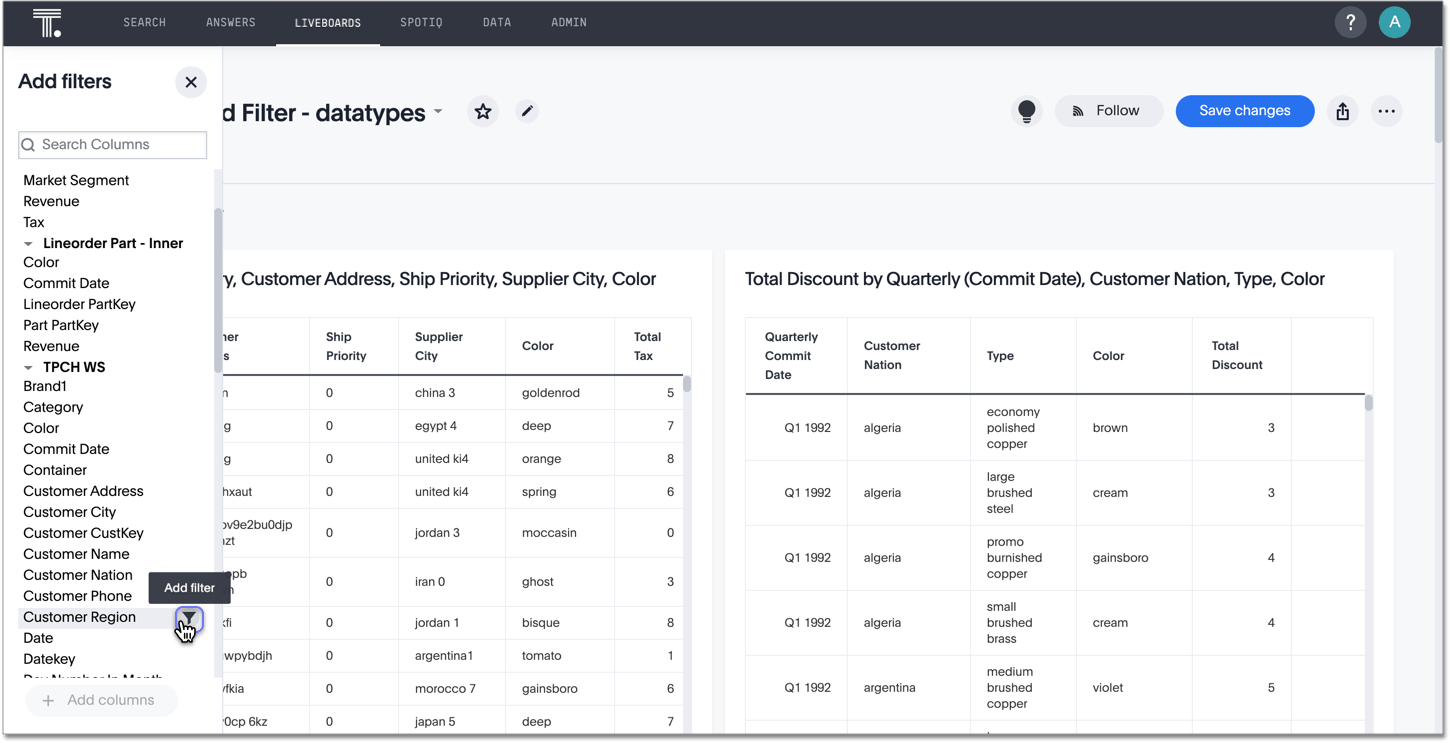
In the Add filters side panel, search for columns you would like to filter on, or open the worksheets the columns are in and click on the correct columns. In this example, we will create a linked Customer region filter. To create a filter without actually filtering the Liveboard, click Done after you choose the column you would like to filter on, instead of specifying values to include or exclude.
-
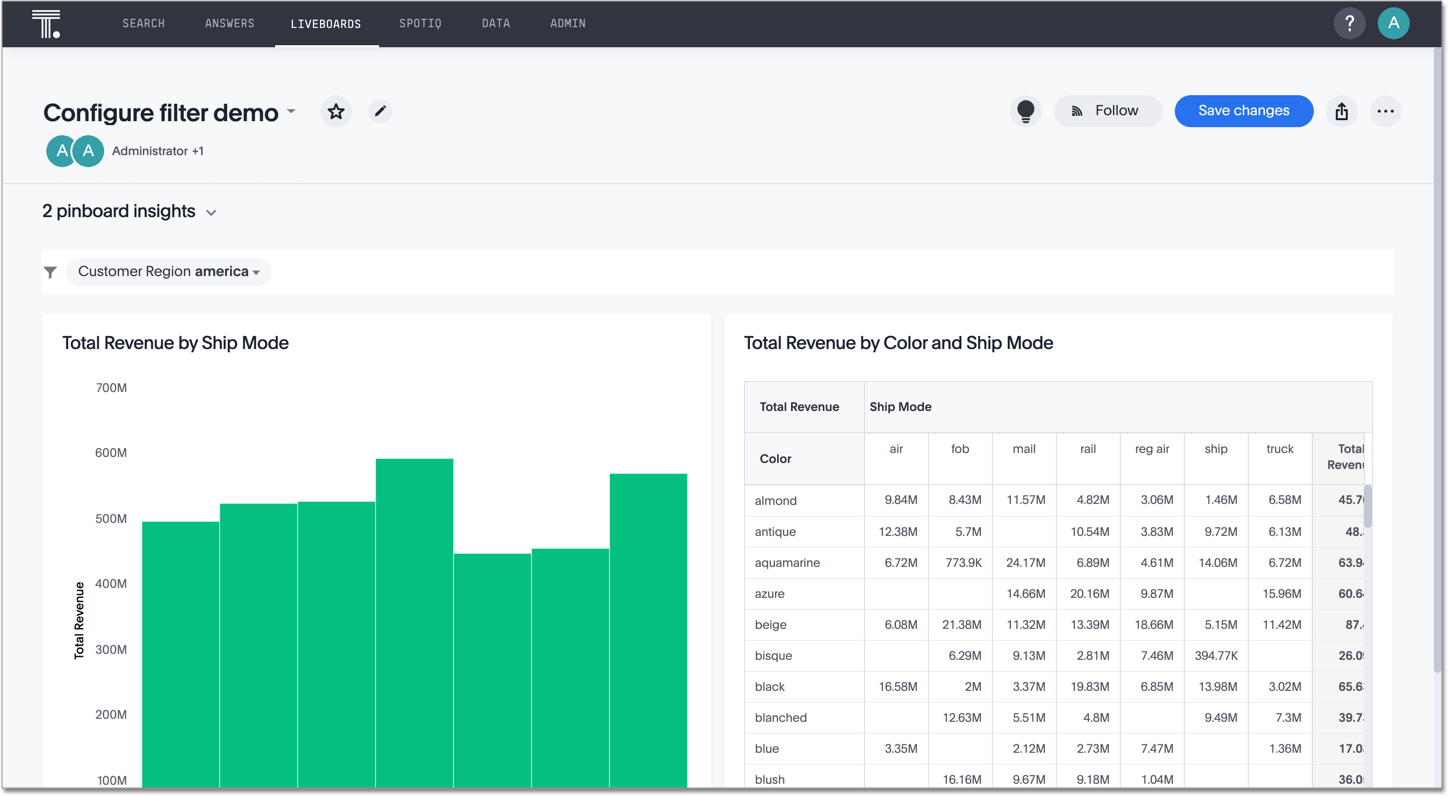
After you add a filter, it appears on the Liveboard filters bar, below the Liveboard name.
-
Now we can create a linked filter. Select the More menu icon
at the upper right, and select Configure filters.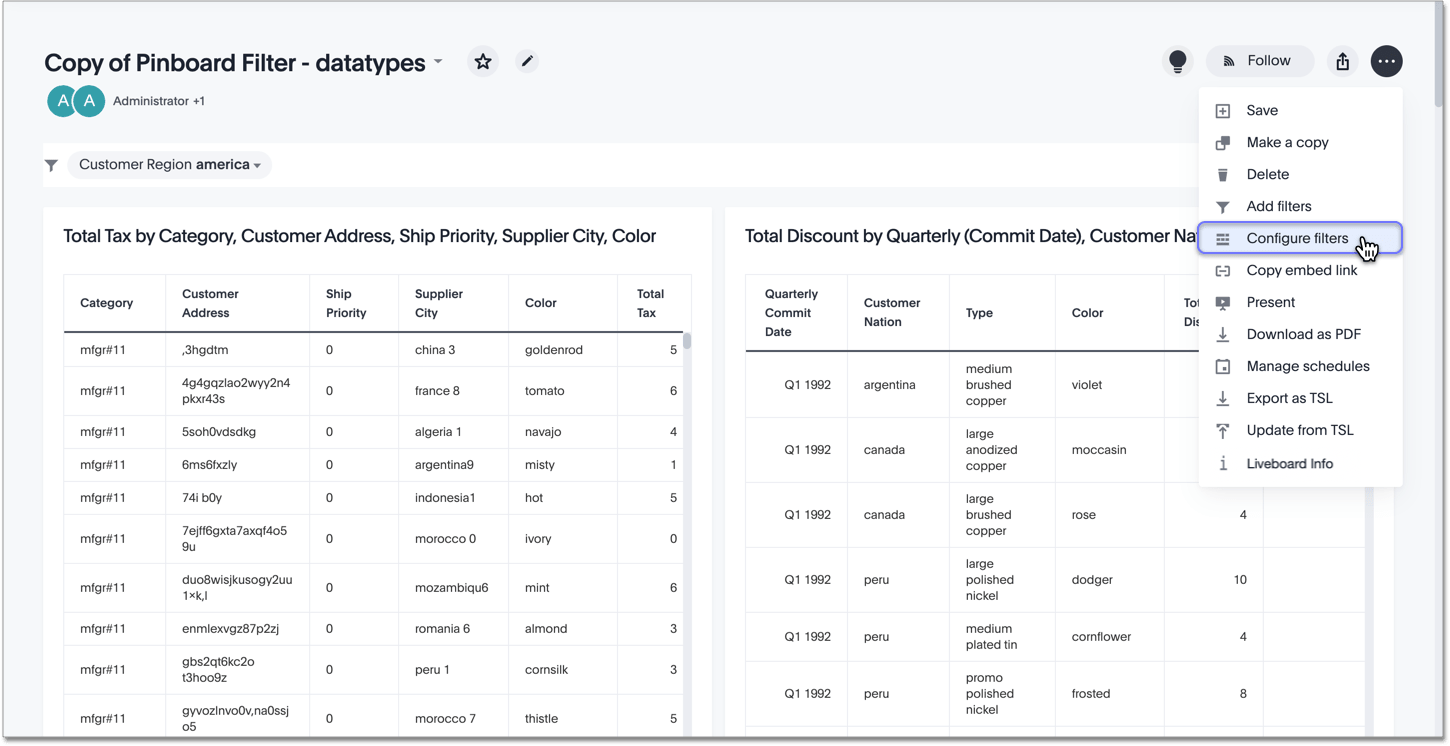
-
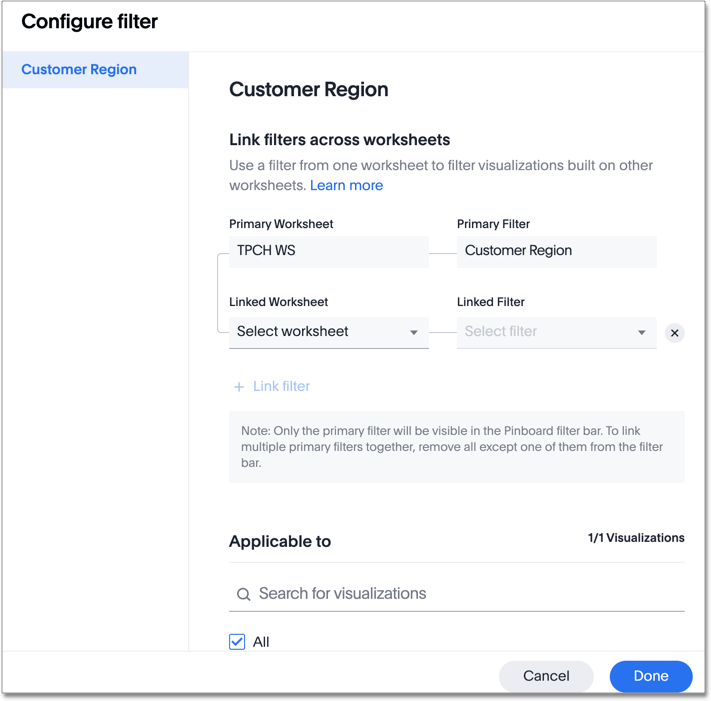
The Configure filter modal appears. The side menu contains every primary filter column for the Liveboard. In this case, we only added one filter: Customer region. So, Customer region is the only column in the side menu.
-
The Primary Worksheet and Primary Filter text boxes contain the worksheet and column that the Liveboard is already filtering on. To link the Customer region filter across worksheets, we must specify the Linked worksheet and Linked filter. Click on the Linked worksheet dropdown, and choose the worksheet that contains the column you would like to filter on. In this case, the Liveboard only uses one other worksheet: Formula worksheet.
-
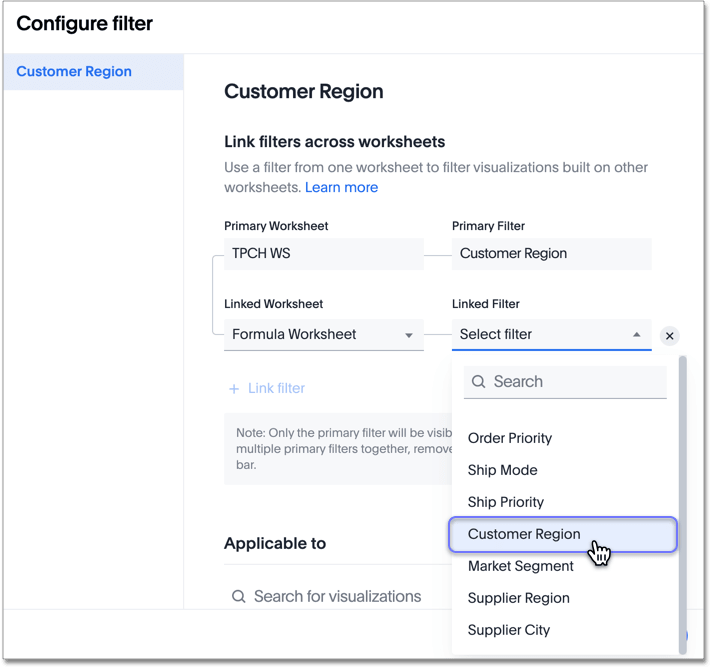
After you select the Linked worksheet, you can select the column to filter on. Use the search box in the dropdown to find the column you need. In this case, we are filtering on Customer region.
-
To link another worksheet’s Customer region column to this filter, click + Link filter. In this case, the Liveboard only uses two worksheets, so the + Link filter option is unavailable.
-
To specify visualizations to apply the filter to, scroll down to Applicable to. You can select the All option, or only choose certain visualizations.
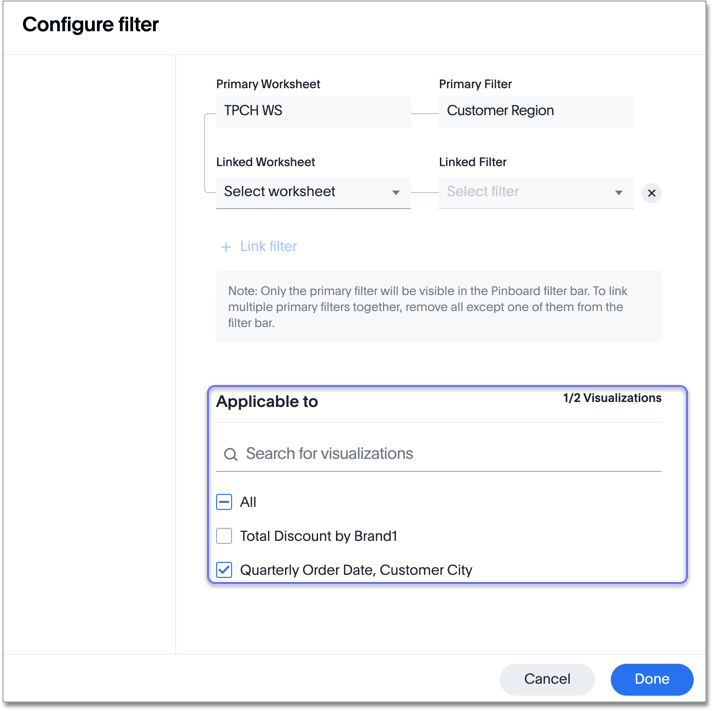
You can specify which visualizations a filter should apply to, even if it is not a multi-worksheet linked filter.
-
Click Done. You can see that all of the visualizations in the Liveboard, or each visualization that you specified, has data specific to the America customer region. There is now one Customer region filter for the two worksheets in this Liveboard. You or viewers of the Liveboard can change the customer region to any of the other regions in the Customer region column.
Limitations of linked filters
-
ThoughtSpot expects the Worksheet columns you link to have the same column values. You can only use the values of the Primary Filter to filter the Liveboard visualizations, so if the value names are different in the Linked Filter, you are unable to filter visualizations based on the Linked worksheet.
For example, in the configuration example, TCPH WS is the Primary worksheet, and the Customer Region column from that worksheet is the Primary Filter. One of the customer regions in TCPH WS might be North America, but the name of that customer in the Linked worksheet, Formula Worksheet, might be NA. In the filter value selection modal, you only see the value from the Primary worksheet, North America. You do not see NA. If you filter based on North America, ThoughtSpot filters only the visualizations based on the Primary worksheet.
-
You can’t link a column to multiple columns in the same worksheet.
-
The filters you create can only be linked to the same data types; you can’t link a DATE column to a DATETIME column.


