Liveboard filters
Filters, including bulk filters and exclude filters, can be applied to Liveboards just as with tables and charts. These kinds of filters apply to an entire Liveboard, making it easy to see only the data that you are interested in across the tables and charts within a Liveboard.
| Starting in May 2022, ThoughtSpot rebranded pinboards as Liveboards. For backward compatibility, we currently support internal processes and external methods that use the older naming convention. |
When to use a Liveboard filter
Liveboard filters can be very useful when you want to apply the same filters to more than one related visualization. You can narrow the focus of your Liveboard for specific purposes or audiences.
When you apply a filter, the Liveboard is not automatically saved with your filter applied. This is to encourage ad-hoc filtering. Therefore, people with read-only access can create Liveboard filters. You must have edit access to the Liveboard, and view access (or higher) to the underlying data source in order to save a Liveboard filter.
Note that Liveboard filters only apply to the tables and charts that are based on worksheets. If a Liveboard also includes tables and charts that were created from underlying tables or on user uploaded data, the filters don’t apply to them.
To create one filter that filters visualizations based on multiple Worksheets, you can link the Worksheet columns, at the Liveboard level. Refer to Linked Liveboard filters.
| The default date in a Liveboard filter must be earlier than 12/31/9999. |
Create a Liveboard filter
You can create a filter in the Liveboard view for any Liveboard. This allows you to easily manipulate the visualizations and view the modified presentation in one place.
Here is an example that shows you how to add a single filter to a Liveboard. To create a Liveboard filter:
-
Click the More menu icon
 , and select Add filters.
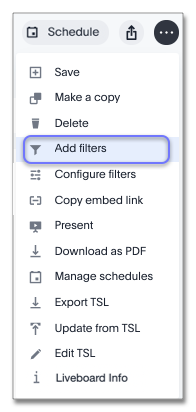
-
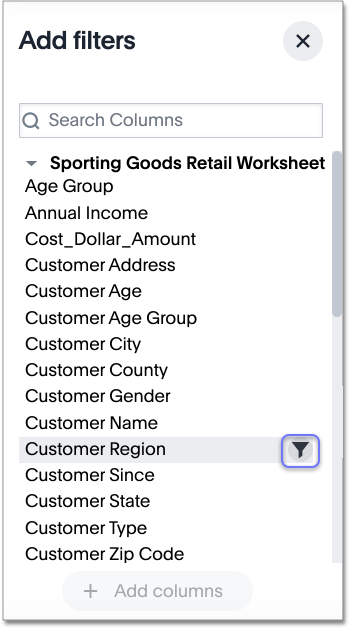
In the populated columns menu, click the Add filter icon next to the column you would like to filter on.
-
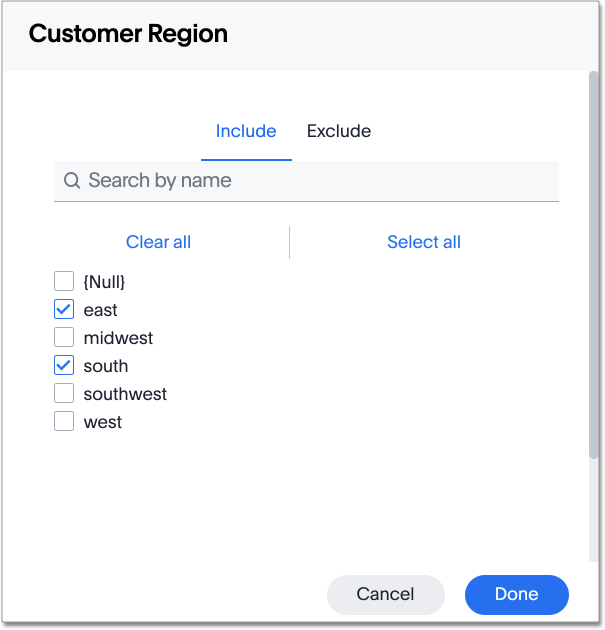
Under Include, select the values to include in your answer. The filter modal only shows 100 values; if the column you selected has more than 100 values, you must use the filter search bar to find the additional values.
-
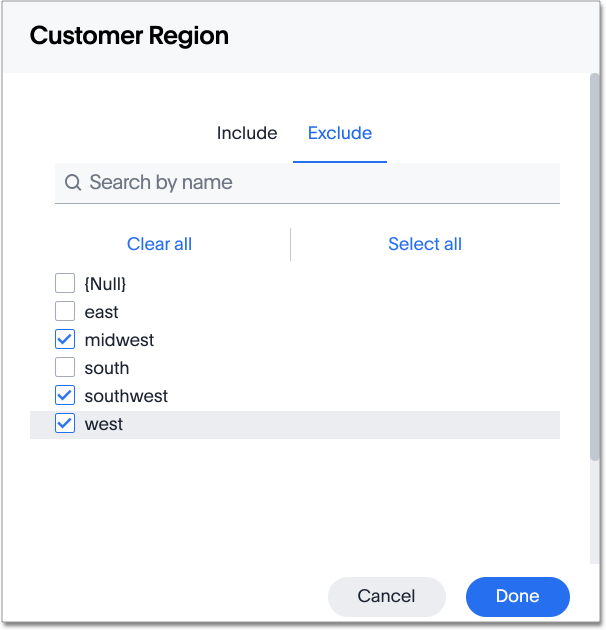
If you want to exclude values, click Exclude and choose values to exclude.
-
Click Done.
When you apply a filter, the Liveboard is not automatically saved with your filter applied to every object in the Liveboard that was created from a worksheet. Liveboard filters do not apply to tables and charts built directly on top of base tables.
Apply filters to specific visualizations
You can apply filters to only certain visualizations that you specify. To specify the visualizations that a Liveboard filter should apply to, follow these steps, or refer to Selective Liveboard filters:
-
Click the More menu icon
for the Liveboard, and select Configure filters.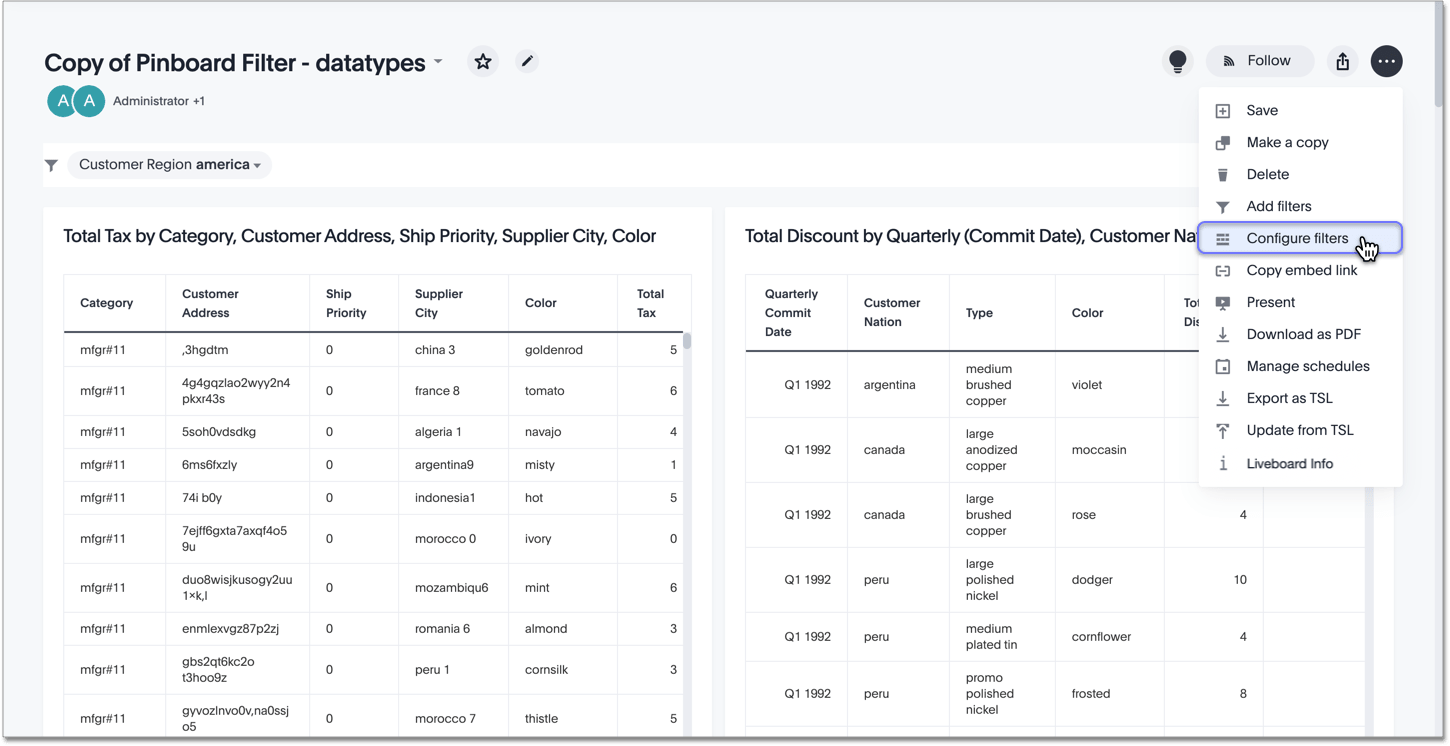
-
In the Configure filters modal, choose the filter you would like to update from the side menu.
-
Scroll down to Applicable to. You can select the All option, or only choose certain visualizations. You can also search for a visualization.
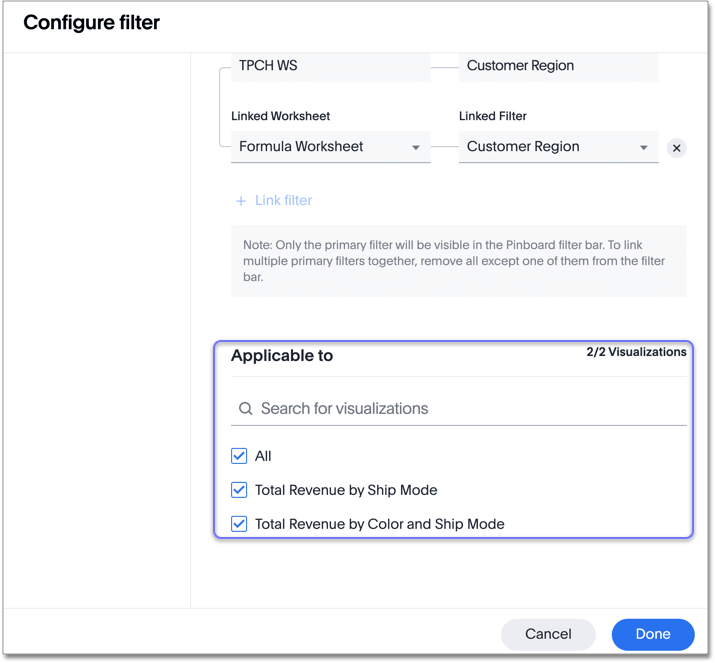
-
Select Done.
Linked filters
You can link columns from multiple worksheets, to create one Liveboard filter for visualizations that come from different worksheets.
To learn how to create linked filters, refer to Linked Liveboard filters.
Edit a filter
Your applied filters appear in a row at the top of the Liveboard, where you can click on them to open the filter window. Then, you can edit the values to include or exclude.