Download a Liveboard as a PDF
In ThoughtSpot, you can download the entire Liveboard in PDF format, so you can share it with people inside and outside your organization. You have options for adding branding, composing the report of the entire Liveboard or only some of its Visualizations, truncating tables, and many others.
| Starting in May 2022, ThoughtSpot rebranded pinboards as Liveboards. For backward compatibility, we currently support internal processes and external methods that use the older naming convention. |
You can download a Liveboard in PDF format, without downloading each visualization separately. Follow these steps:
-
Click Liveboards on the top navigation bar.
-
Select a Liveboard from the list of Liveboards by clicking on its title.
-
In the open Liveboard, click the More Options menu
 (ellipses icon), and select Download as PDF.
 -
In the Download window modal, you have two main Format output options:
-
Select Liveboard to generate a PDF that combines several visual answers on the same page, just like they appear on the Liveboard.
-
Select Visualizations to print each visualization on its own page of the PDF file.
-
Download PDF as Liveboard
The Liveboard mode produces a PDF file that looks very similar to the Liveboard inside ThoughtSpot. The highlights appear at the top, and the rest of the Liveboard is on a rectangular grid, with natural page breaks.
Follow these steps to specify additional options:
-
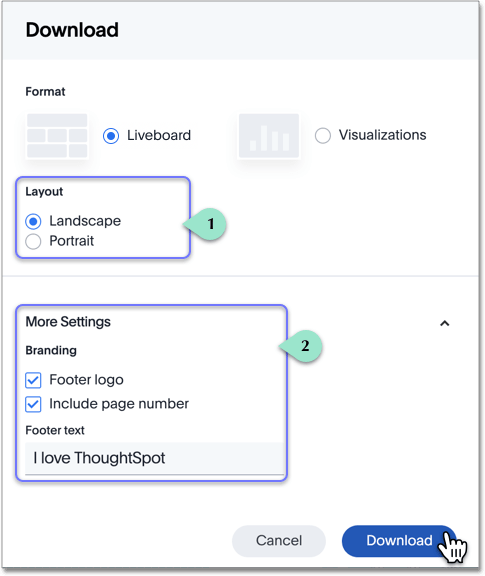
Under Format, select Liveboard.
-
Under Layout, select either the Landscape or Portrait page orientation.
-
Click the More Settings option.
Under Branding, specify if you want to add a Footer logo, Include page number, or add Footer text.
-
Click Download.
Download PDF as Visualizations
When you select Visualizations, you can choose to print all, or some, of the visualizations in the Liveboard. The highlights and insights appear at the top, and the rest of the visualizations get their own page.
Follow these steps to specify additional options:
-
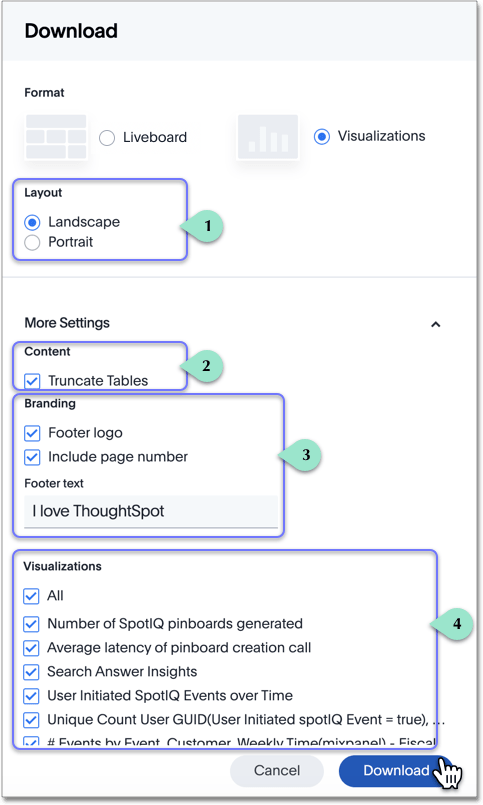
Under Format, select Visualizations.
-
Under Layout, select either the Landscape or Portrait page orientation.
-
Click the More Settings option.
Under Content, specify if you want the table visuals to end after filling the whole page by selecting the Truncate Tables option.
-
Add Branding details through the Footer logo, Include page number, or Footer text options.
-
Under Visualizations, select the visualizations you want in the PDF. Deselect any visualizations you do not want.
-
Click Download.
Examine the PDF
After the download completes, examine your PDF.
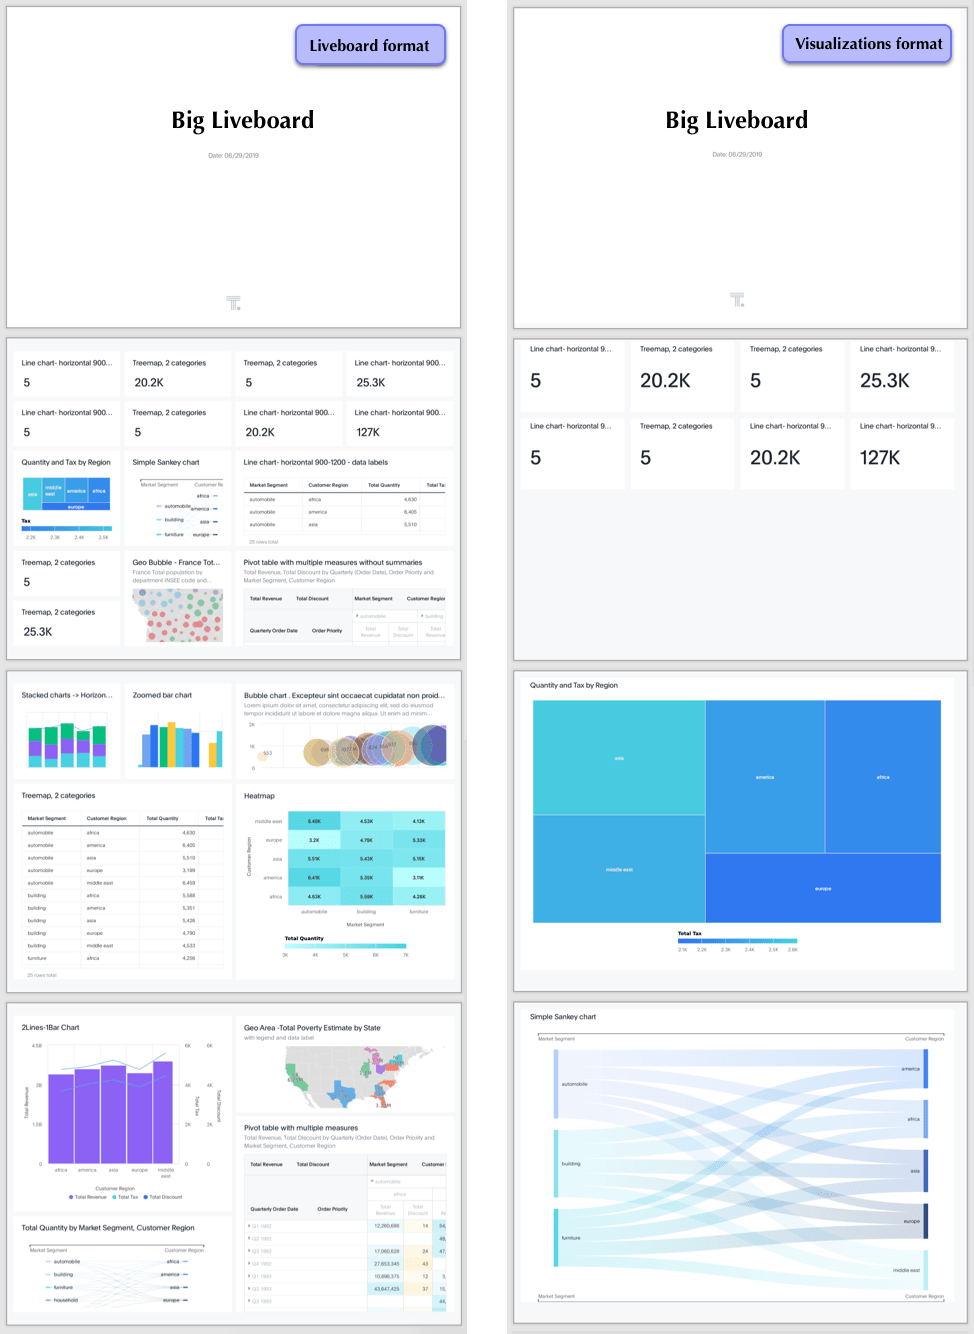
Notice that the PDF produced in Liveboard mode combines the visuals on the page in the same manner as the original Liveboard. Contrast this with the PDF produced in Visualizations mode: this PDF combines the small adjacent indicator and KPI visuals at the top, and all other visuals and tables appear on their own page.
When you download tables with date columns or view these tables in scheduled Liveboards, the format for those dates may differ from their appearance in ThoughtSpot, depending on the type of download.
XLSX files appear as they do in ThoughtSpot, but CSV and PDF files may look different. The following date bucketing types may look different for CSV and PDF downloads:
| Bucketing Type | Appearance in ThoughtSpot and XLSX download | Appearance in CSV or PDF |
|---|---|---|
Hourly |
AM/ PM |
24 hour |
Day of week |
Name of day (for example, Saturday) |
Number of day (for example, 6)[1] |
Monthly |
January 2021 |
1/1/2021 |
Month of year |
Name of month |
Number of month[2] |
Quarterly |
Q1 2021 |
1/1/2021 |
Quarter of year |
Name of quarter (for example, Q4) |
Number of quarter (for example, 4) |
Yearly |
2021 |
1/1/2021 |


