Geo bubble charts
Geo bubble charts, like bubble charts, display the value of the measure through the relative size of the bubble. Zip code data is a good choice for geo bubble charts.
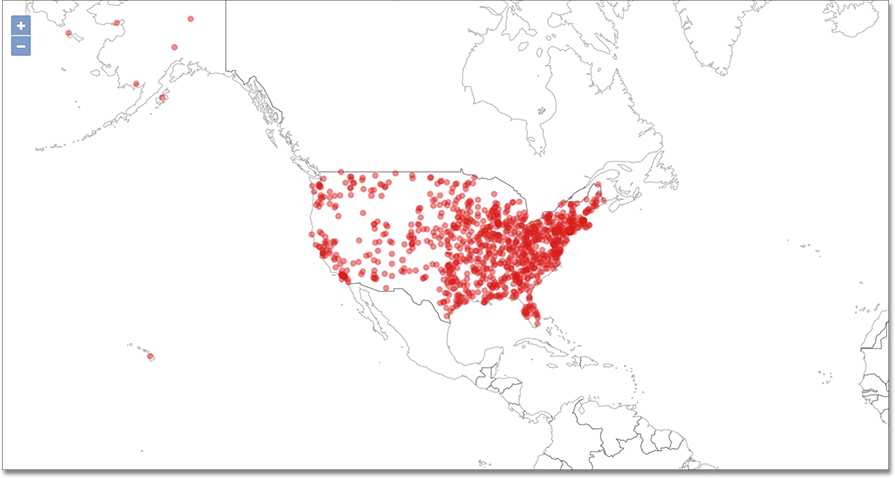
To paint a geo bubble chart, your search must include a geographical column, or a latitude and longitude pair.
See Geo map reference.
See also the full introduction to Geo charts and specifics of working with them.
Was this page helpful?Give us feedback!


