ThoughtSpot Software Documentation
ThoughtSpot Software is our original offering that you deploy and manage yourself. For details on all deployment options, see ThoughtSpot Software Deployment.
Find topics for the common types of ThoughtSpot users.


What’s new in ThoughtSpot Software
August 2022 8.4.1.sw
| Features marked as Beta are off by default. To enable them, contact ThoughtSpot Support. |
Data workspace
The new Data Workspace is now GA and on by default. It redesigns the Data section of the product. To access it, select Data from the top navigation bar. The redesign introduces several new features, such as SQL-based views and dbt integration, and makes the UI more intuitive. For more information, see Data workspace.
dbt integration
The dbt integration is now GA and on by default. With the new dbt integration, you provide your existing dbt models and ThoughtSpot automatically creates worksheets you can use to query your data. Integration with dbt is certified only for Snowflake connections. To try it out, navigate to the Data tab, and select Utilities. Select dbt Integration. For more information, see dbt integration.
SQL views
SQL-based views are now GA and on by default. You can now create a view based on a custom SQL query, and use that view as a data source. To try it out, select Data from the top navigation bar. Then select + Create new > Custom SQL view. For more information, see SQL views.
New answer experience Beta
The new answer experience contains new features and enhancements, including an in-product undo, redo, and reset button, HTML for answer titles and descriptions, and improvements to conditional formatting for charts, tables, and pivot tables.
To try it out, navigate to your profile, scroll down to Experience, select Edit, and toggle the Answer experience to New experience. For more information, see New answer experience.
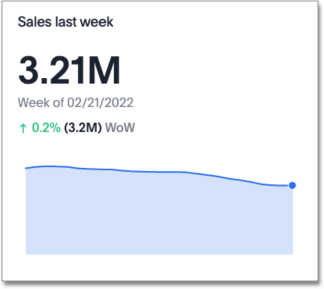
Key Performance Indicator (KPI) chart type
KPI charts are now GA and on by default. You can now create visualizations of your data’s Key Performance Indicators (KPIs). When you search for a measure with a time-related keyword (for example, Sales weekly), you can create sparkline visualizations of your data’s Key Performance Indicators (KPIs). ThoughtSpot also supports conditional formatting to add visual cues for KPIs or threshold metrics to easily show where you are falling short or exceeding targets. This feature is dependent on the new answer experience; to use KPI charts, you must first enable the new answer experience.
For more information on KPI charts,
see KPI charts.
Auto-select search data source for new users
When a new user uses Search Data, ThoughtSpot intelligently selects a data source for them to search on. ThoughtSpot chooses the most popular data source in the cluster that the user has access to. This allows users to begin to search data easily, without looking through all the existing data sources on their cluster. For more information, see Choose a data source.
Geo map support for France postcode
We now support more detailed geographic maps for France. You can now create maps based on postal codes, as well as region and city name. For more information, see Geo map reference.
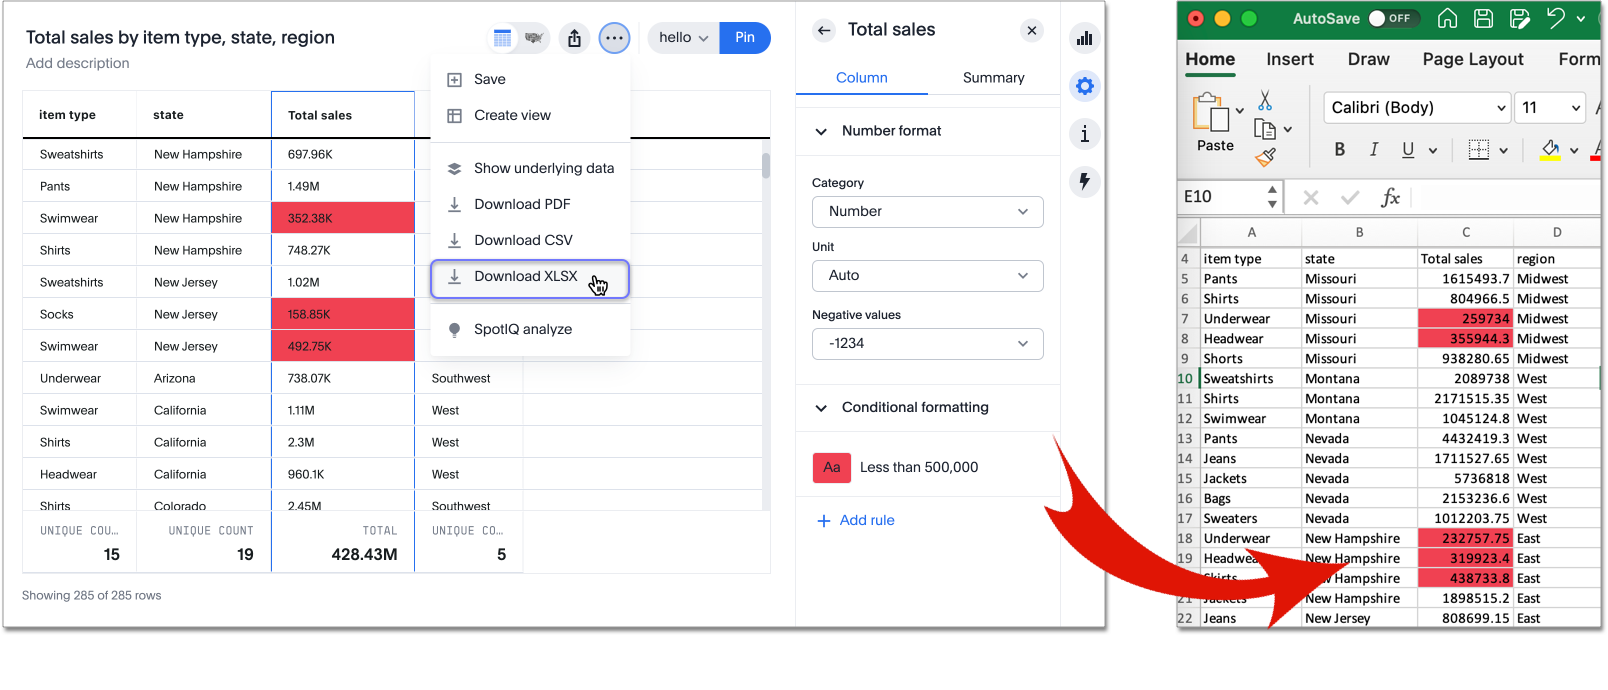
Conditional and number formatting for downloaded tables
When you download a table in XLSX format, the downloaded table now shows the same conditional and number formatting as the table in ThoughtSpot. It also shows the same column width, number formatting based on the format patter, and date formatting as the table in ThoughtSpot. For more information on downloaded tables,
see Download a search.
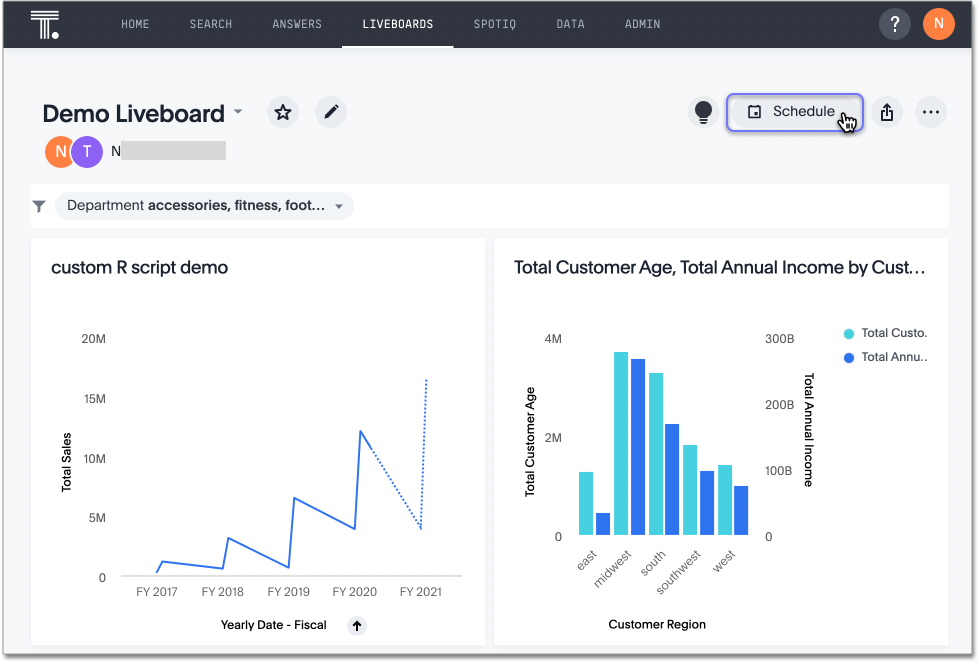
Liveboard schedule
ThoughtSpot now combines the Liveboard follow and Liveboard Schedule features into a single action called "Schedule." To create a new schedule to receive an email containing a pdf of your Liveboard, users now select the Schedule button to the left of the more options menu ![]() .
.
ThoughtSpot will migrate any existing Liveboard follows to Liveboard schedules. For users who followed a Liveboard in 7.2.1 or earlier, those Liveboard schedules appear in the list of Liveboard schedules as Migrated from follow (your display name). For more information, see Schedule a Liveboard job.
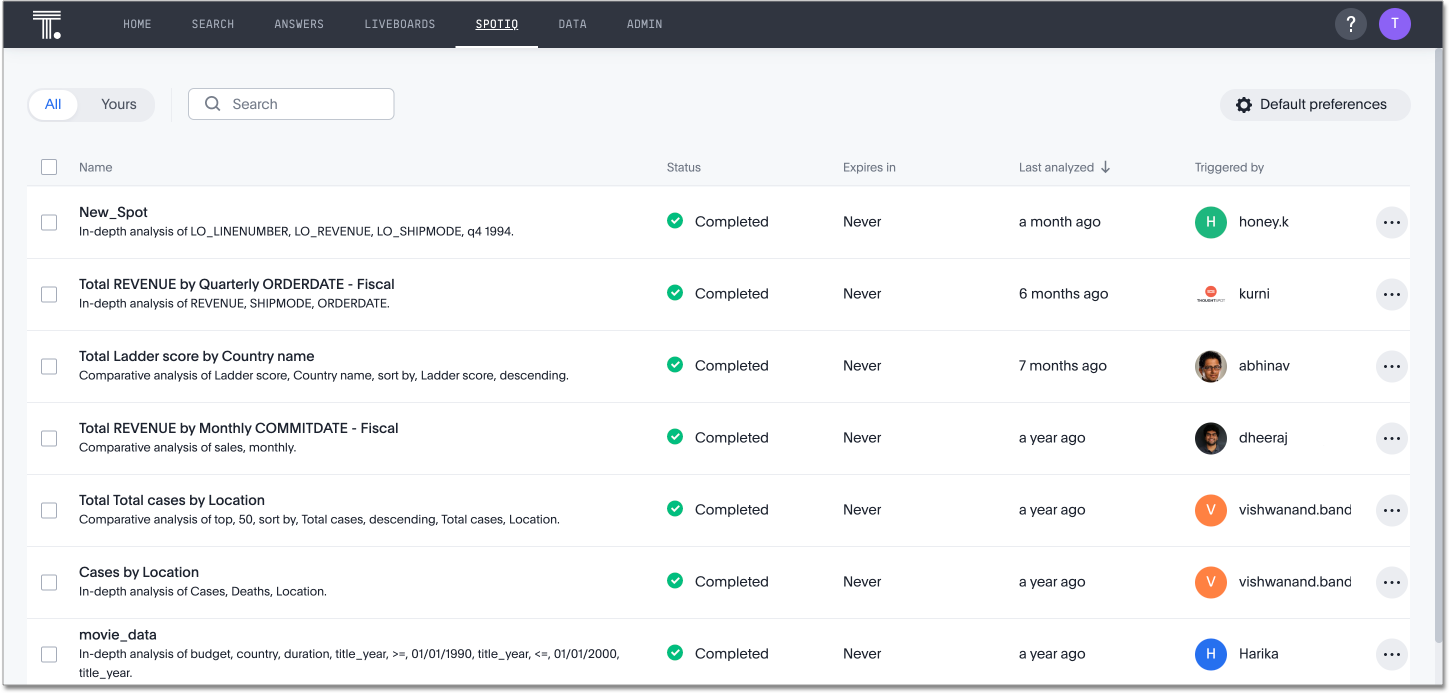
New SpotIQ experience Beta
SpotIQ has a new reorganized and more intuitive UI. The functionality remains the same.
To try it out, navigate to your profile, scroll down to Experience, select Edit, and toggle the SpotIQ experience to New experience. This feature is dependent on the new answer experience; to use the new SpotIQ experience, you must first enable the new answer experience. For more information, see SpotIQ.
Other features and enhancements
Query external tables
ThoughtSpot now supports querying external tables in data stores, after you create these tables in your Amazon Redshift, Google BigQuery, or Snowflake environments. For more information, see Query external tables from your connection.
OAuth for Databricks
Databricks connections now support OAuth. For more information, see Configure OAuth for a Databricks connection.
Okta OAuth for Snowflake
Snowflake connections now support Okta OAuth. For more information, see Configure Okta OAuth for a Snowflake connection.
Date interval functions
We introduced new functions for computing time intervals between two dates. In addition to the existing diff_days and diff_time functions, you can now use diff_years, diff_quarters, diff_months diff_weeks, diff_hours, and diff_minutes to calculate time intervals.
If your organization uses a custom calendar for your fiscal year, use the optional custom calendar argument with these functions to calculate the difference between the two dates. For more information, see Formula reference.
Streamlined analyst setup
We simplified the steps to set up an analyst account on ThoughtSpot. Now, you can create a connection, create a worksheet to model your business use cases, immediately search your data, and automatically create Search visualizations. For more information, see Analyst onboarding and Create answers in Setup.
This feature is specific to clusters based on connections to external data warehouses, not imported data (Falcon). To enable this feature for your cluster, contact ThoughtSpot Support.
VMware ESXi 7.0 support
ThoughtSpot now certifies VMware vSphere Hypervisor (ESXi) 7.0 for VMware deployments of the ThoughtSpot product. ThoughtSpot certifies VMware 7.0 only for ThoughtSpot version 8.4.1.sw. For more information, see VMware configuration overview.
Python 3.9 upgrade
For ThoughtSpot-managed CentOS clusters hosted on AWS, Azure, and GCP, Python 3.9 is now the default Python version. For customer-managed RHEL, OEL, or Amazon Linux 2 clusters, and for ThoughtSpot-managed CentOS clusters hosted on VMware, SMC, and Dell, the default Python version is still either 3.6 or 3.7. For more information, see Upgrade your Python version.
System information Liveboards
We moved several system monitoring Liveboards to new areas of the product. The System information and usage Liveboard is now in the Admin Console, under System Information. The Table status Liveboard is now in the Admin Console, under Table Status. The Connections Liveboard is now in the Data Workspace, under Usage statistics. For more information, see Admin Console and Data workspace.
ThoughtSpot Everywhere
Customers licensed to embed ThoughtSpot can use ThoughtSpot Everywhere features and the Visual Embed SDK.
To enable ThoughtSpot Everywhere on your cluster, contact ThoughtSpot Support.
For new features and enhancements introduced in this release for ThoughtSpot Everywhere, see ThoughtSpot Developer Documentation.


