ThoughtSpot Software Documentation
ThoughtSpot Software is our original offering that you deploy and manage yourself. For details on all deployment options, see ThoughtSpot Software Deployment.
Find topics for the common types of ThoughtSpot users.
What’s new in ThoughtSpot Software
May 2023 9.0.1.sw
| Features marked as Beta are off by default. To enable them, contact ThoughtSpot Support. |
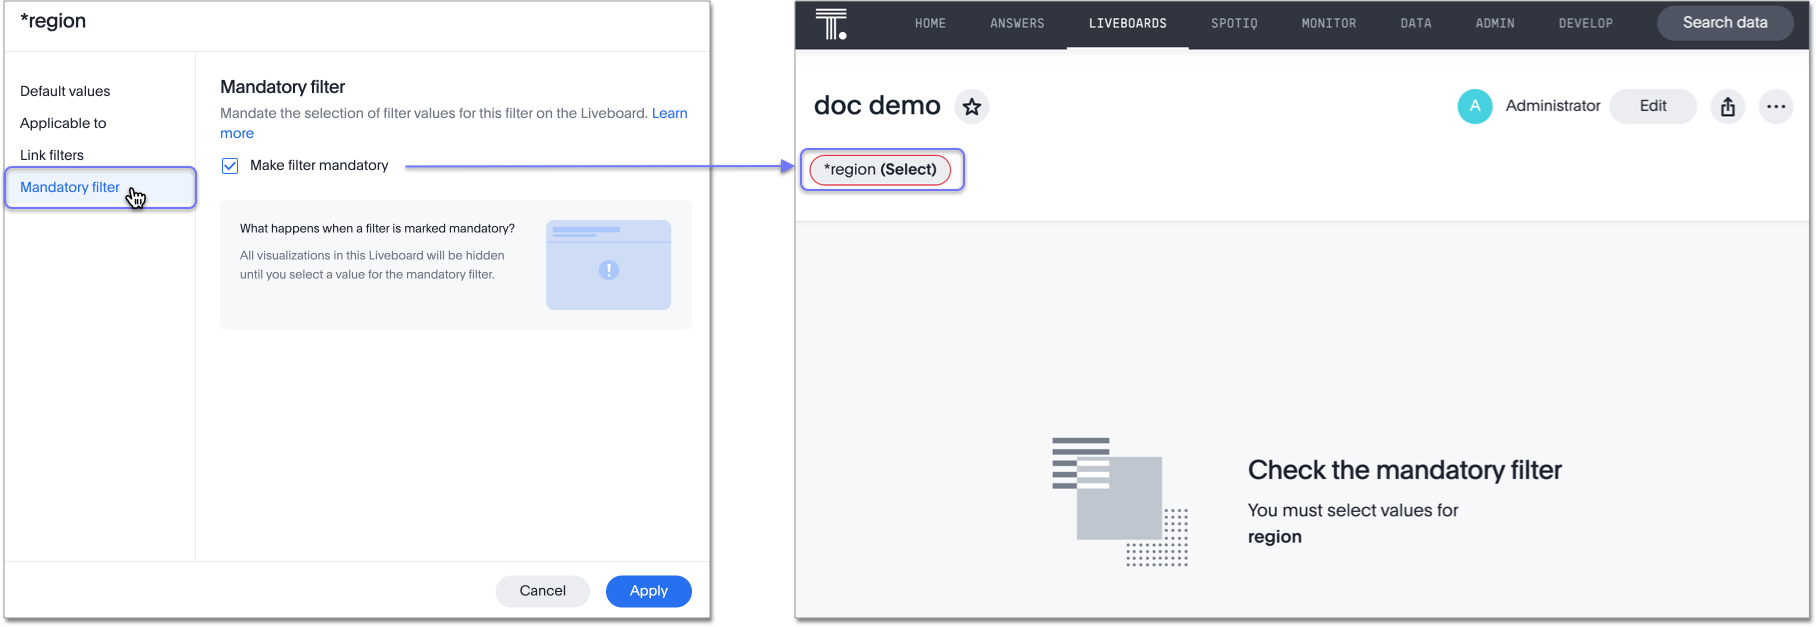
Mandatory Liveboard filters
Mark certain filters in your Liveboard as mandatory. If you add mandatory filters to a Liveboard, the visualizations will only load after Liveboard viewers select values for the mandatory filters. Use mandatory filters for Liveboards that contain data that may not be relevant for everyone who must view and consume the Liveboard. Mandatory filters also lower query and performance costs. To try the feature out, select Mandatory filter when adding a filter to a Liveboard. This feature must be enabled by your administrator. For more information about mandatory filters, see Mandatory Liveboard filters.
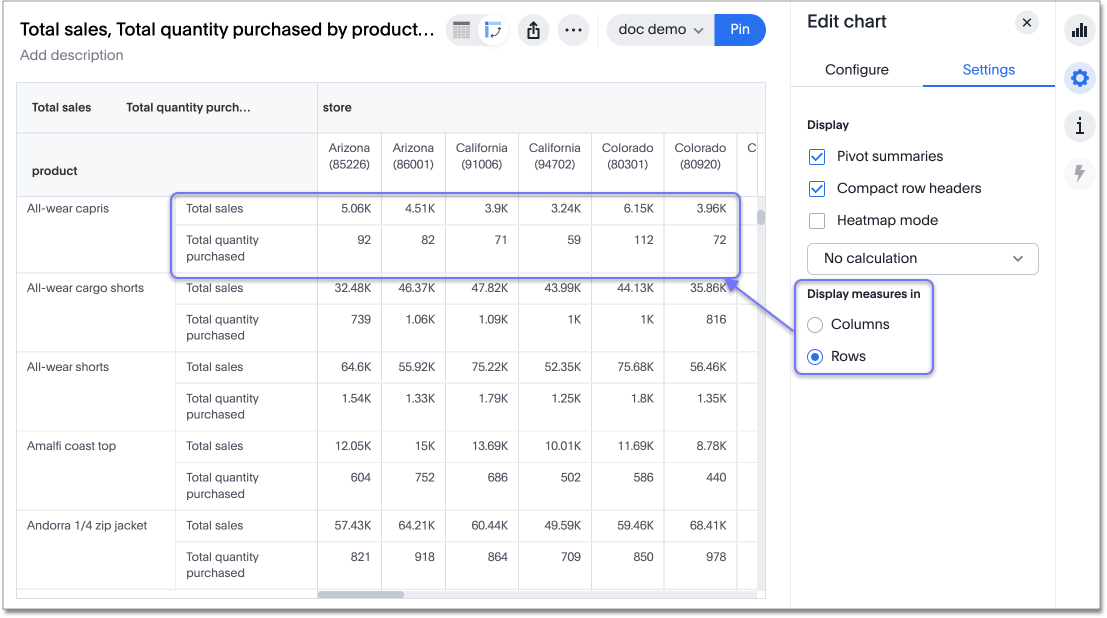
Show measures in pivot table rows
By default, ThoughtSpot displays measures in columns in pivot tables. With this release, choose whether to display measures in rows or columns in your pivot tables. To try it out, in the chart configuration panel for a pivot table, select Settings > Display measures in rows. For more information, see Reorder your pivot table.
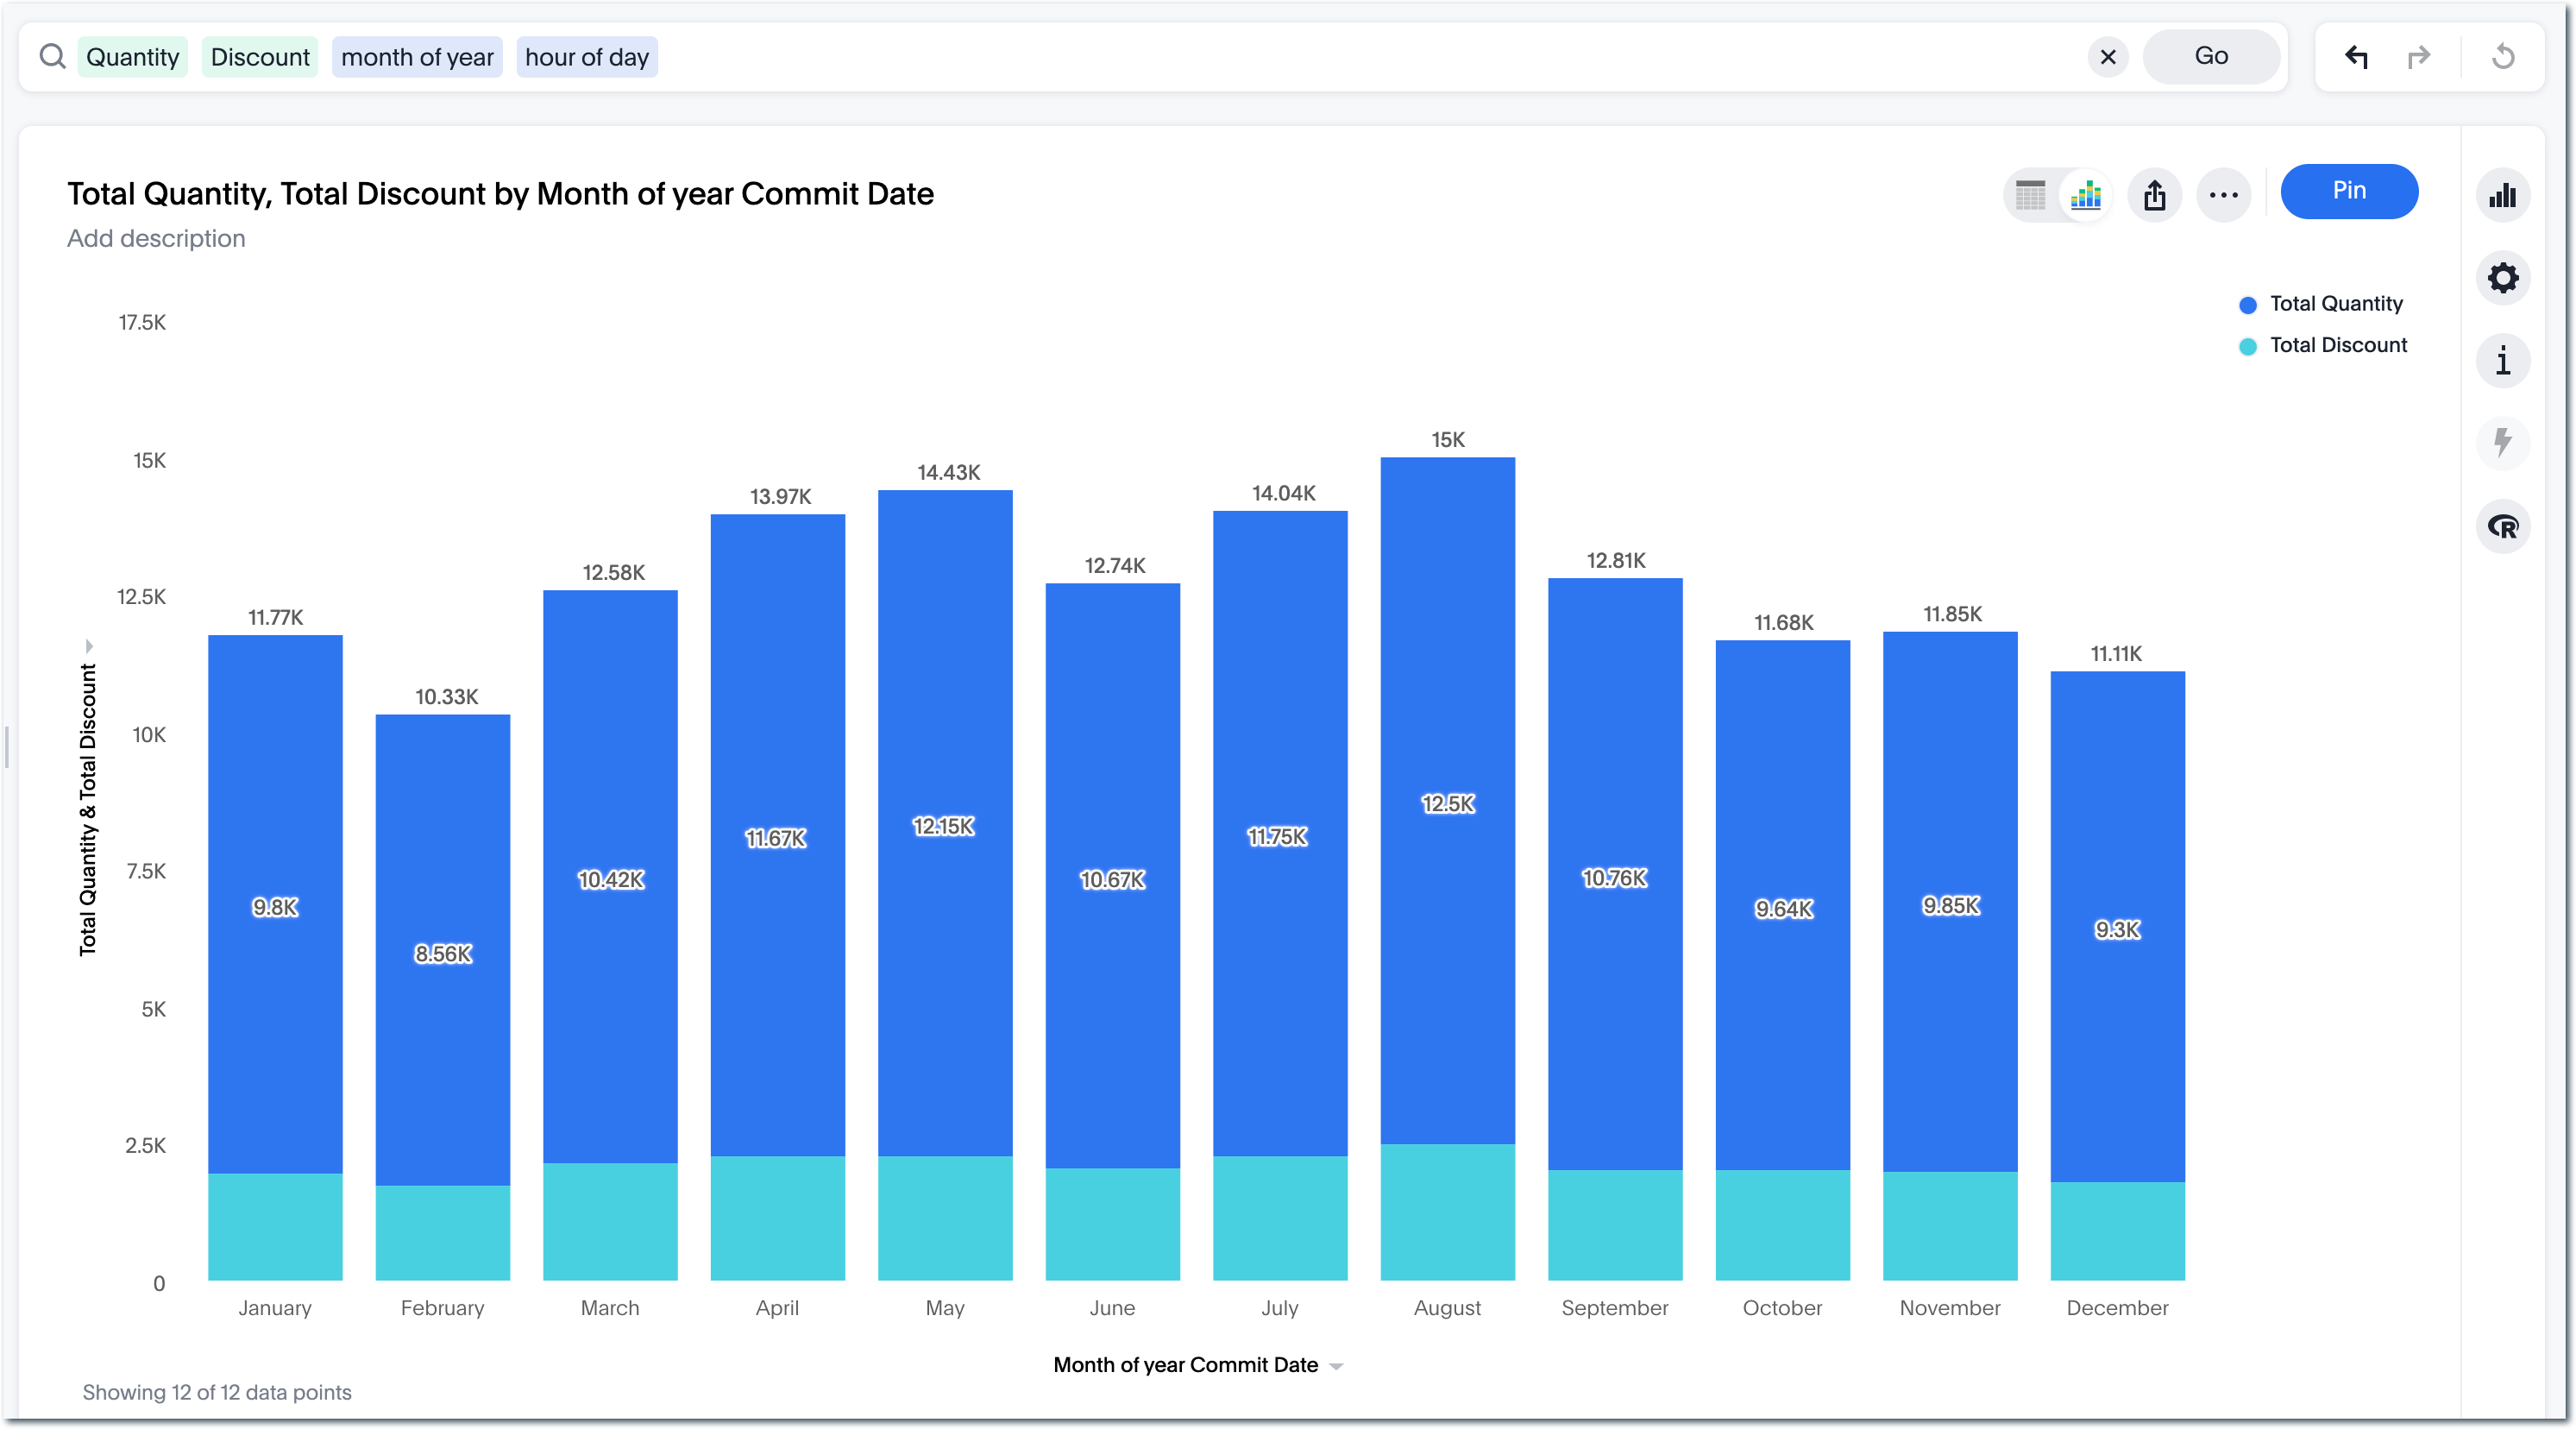
Data labels on a dark background
Labels that appear on a dark background can be displayed in a lighter text color, making them easier to read. To try it out, navigate to Search data and Create a chart > Change the chart color, and Add labels. This feature must be enabled by your administrator. For more information, see Show data labels.
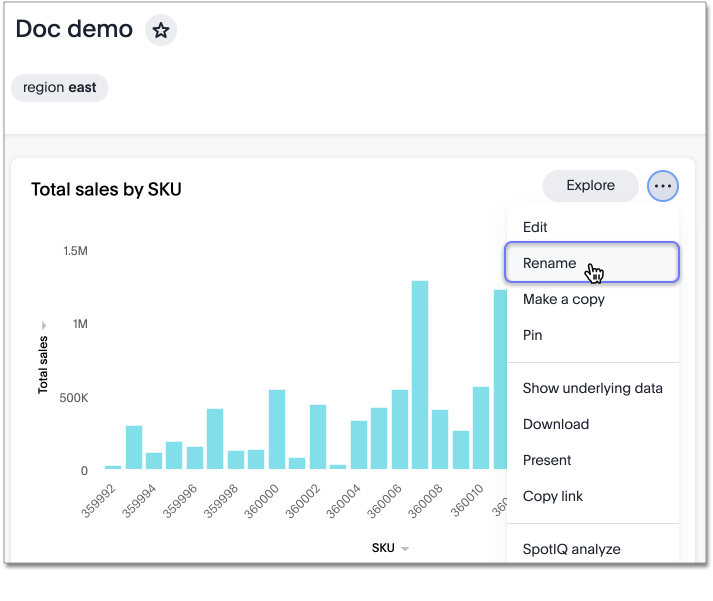
Rename Liveboards and visualizations in view mode
Change the name or description of a Liveboard or visualization from view mode. The more ![]() menu for Liveboards and Liveboard visualizations now includes a Rename option, where you can edit the object name and description. To try it out, navigate to a Liveboard, and select the more
menu for Liveboards and Liveboard visualizations now includes a Rename option, where you can edit the object name and description. To try it out, navigate to a Liveboard, and select the more ![]() menu for a visualization. For more information, see
Other Liveboard edits.
menu for a visualization. For more information, see
Other Liveboard edits.
Apply multiple chart changes at once
When a user drags and drops the fields in the chart configuration panel, the chart reloads. When a user has multiple fields, they need to rearrange a lot of them to reach a desired chart. Now users can make multiple configurations, and apply them all at once, rather than waiting in between each configuration. To try it out, click Apply in the chart configuration panel of edit chart. This feature must be enabled by your administrator.
For more information, see Reorder labels on the axis or legend.
Edit display name from profile
You can now edit your display name by clicking the profile icon in the upper-right corner of the screen and clicking on the Edit button next to Name. For more information, see Edit display name.

Group aggregation enhancements: filters Beta
Previously, when using group_aggregate formulas, users could use query_filters to include filters entered in the search bar in the formula’s value, but it was difficult to write a formula that accepted filters from only a single column.
Starting with this release, you can specify column names within the ‘filters’ section of a group_aggregate formula, and any filter in your search bar referencing that column will be added to the formula. Filters entered in the search bar that are not on columns specified in the third argument of the group_aggregate formula will be ignored. For details, see Group aggregation filters.
Improvements to French keywords
This release improves the translated French keywords. For more information, see Français (France) keyword reference.
Other features and enhancements
Parameters Beta
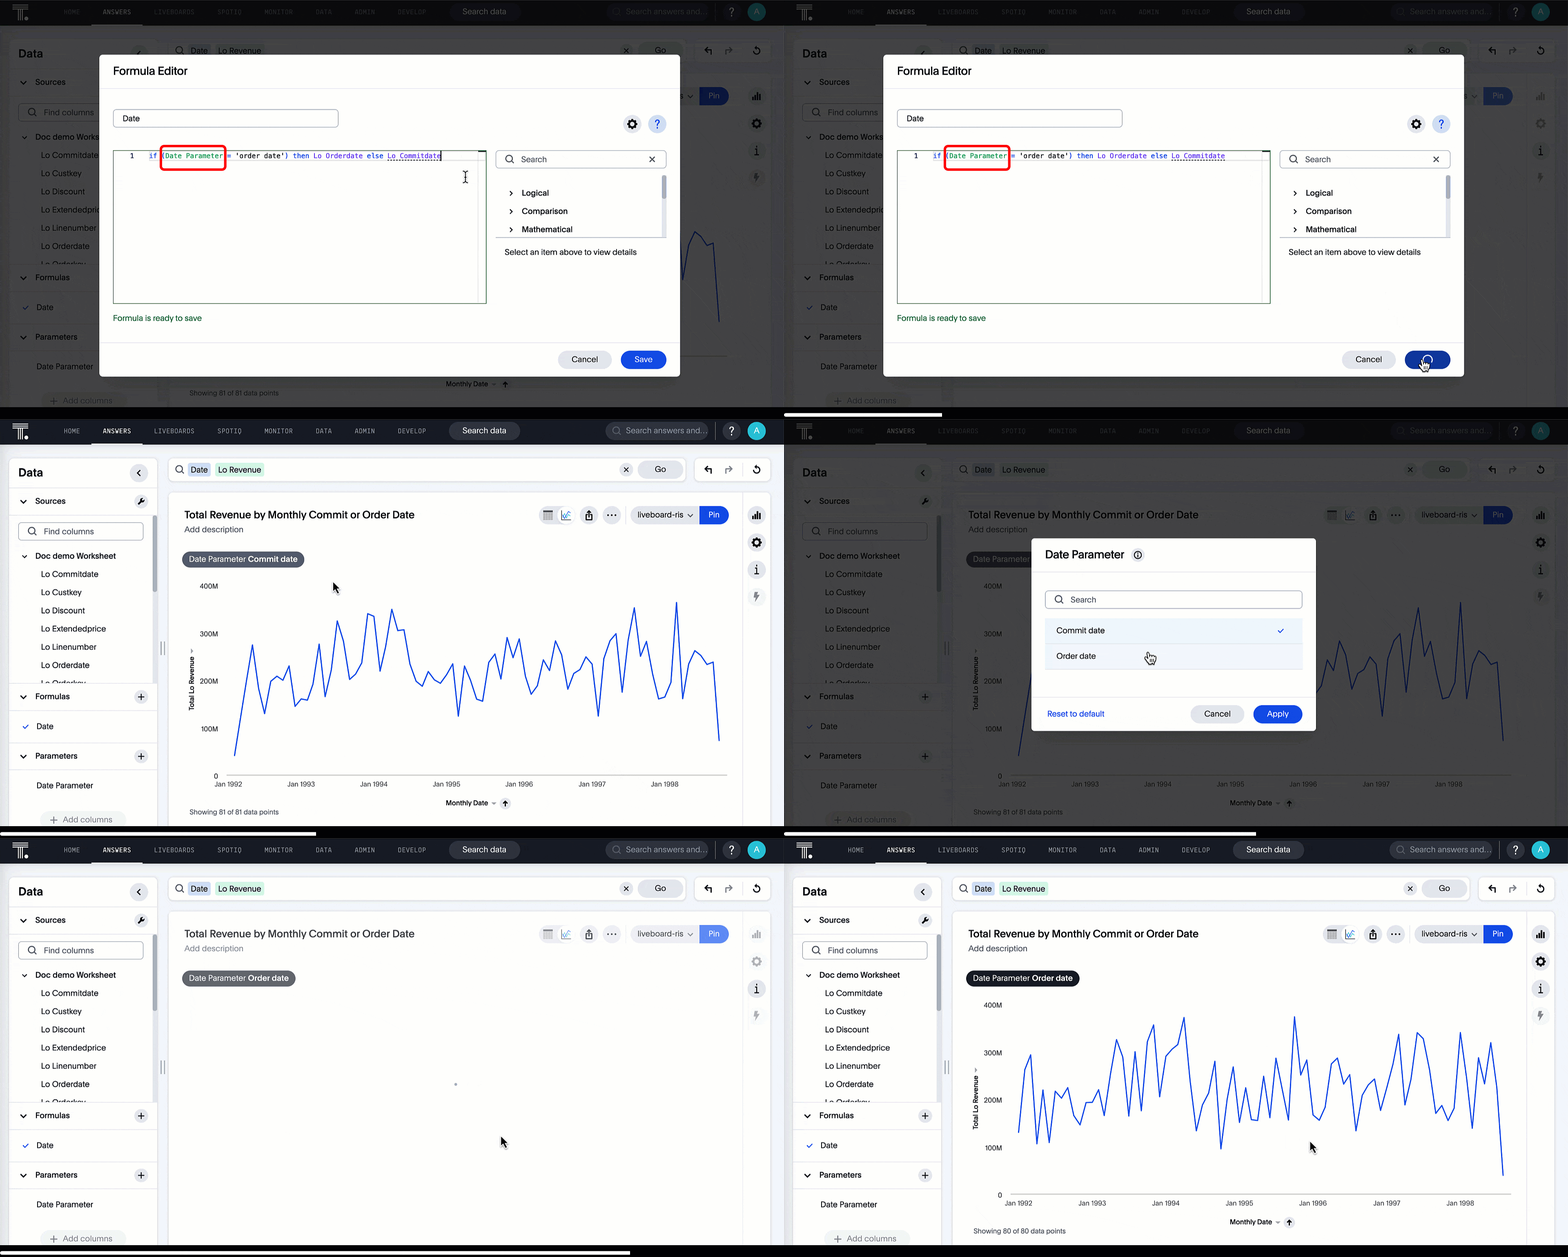
Create Worksheet parameters to optimize your data inquiries. Use parameters to run different scenarios with adjustable values, without creating or modifying the constants in formulas for each new value. For example, easily adjust the attribute in an Answer to view your revenue by commit date or order date, as in the following gif. To try it out, edit a Worksheet, and select the + button that appears when you hover over the Parameters section. For more information about parameters, see Creating parameters and Using parameters.
Upload custom geo maps
Upload your own custom maps and visualize data on geo charts with regions that are specific to you and your organization. To try it out, select Custom maps in the Admin Console. This feature must be enabled by your administrator. For more information about custom geo maps, see Upload custom geo maps.

PostgreSQL connection
You can now create connections from ThoughtSpot to PostgreSQL. For details, see PostgreSQL.
Sharing connections
You can now share connections with other users or groups. Once granted access to a connection, users can add, remove, and modify tables in that connection. For more information, see Share a connection.
dbt metadata tags for tables and Worksheets
Manage your ThoughtSpot table and Worksheet column properties and table joins in dbt by using metadata tags to define column properties and joins within your dbt model schema. Your dbt models contain all the necessary information, and you don’t have to manually update the columns in ThoughtSpot when you make changes to your dbt model. To try it out, update the .yml schema files for your dbt models with the new metadata tags. For more information, see
Metadata tags for dbt.
SQL Server with Embrace Synapse
In this release, we now officially support using SQL server with a Synapse connection. For more information, see: Add an Azure Synapse connection.
Tag enhancements
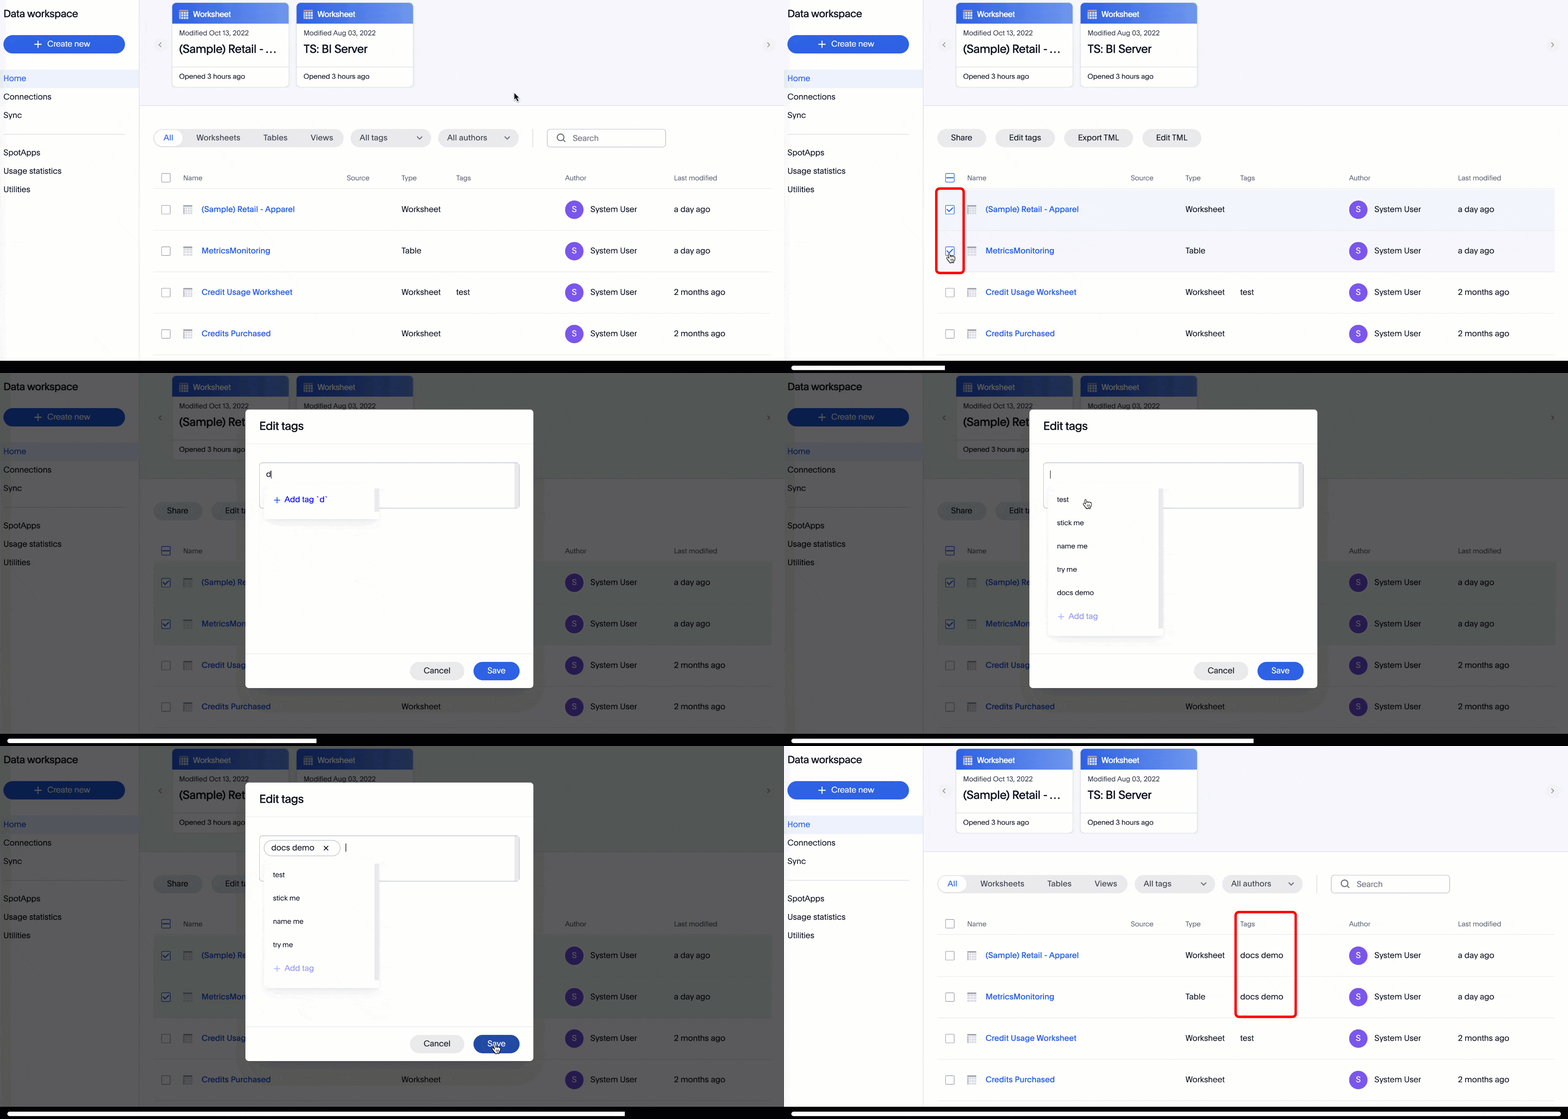
This release includes the following updates to the tags feature in the Data workspace:
-
Add tags to multiple objects at a time
-
Administrators can create new tags from the Edit tags modal
To try it out, select an object in the Data Workspace, and select Edit tags. For more information, see Apply a tag and Create a tag.
Include FQNs when exporting TML files
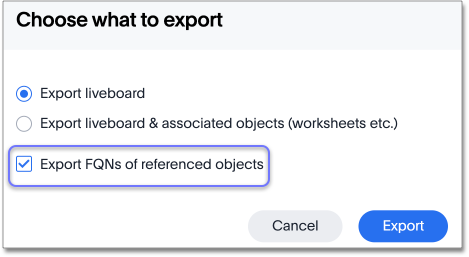
To reduce ambiguity when exporting TML files, you can export the fully qualified names (FQNs) for the objects' data sources. If you select this option, the TML file contains FQNs for the underlying tables and connections. To try it out, select Export FQNs of referenced objects when exporting TML files. For more information, see ThoughtSpot Modeling Language.
Visualization GUID support in TML files
Liveboard ThoughtSpot Modeling Language (TML) files now contain distinct GUIDs for each visualization in the Liveboard by default. This ensures that the GUID for the visualization stays the same after you import or export it. To try it out, select the Export TML menu option for a Liveboard. For more information, see ThoughtSpot Modeling Language.
Delete joins and RLS rules through TML
When you edit and import table TML files, ThoughtSpot now supports deletion of joins at the table level and row-level security (RLS) rules. To try it out, delete the lines in a table TML file that contain RLS rules or joins, and import the object. For more information, see ThoughtSpot Modeling Language.
Delete or make a copy of objects from the details page
Delete or make a copy of Worksheets and Views from an object’s details page. To try it out, open any Worksheet or View, and select the more menu ![]() . For more information, see
Make a copy of a Worksheet and Make a copy of a SQL-based View.
. For more information, see
Make a copy of a Worksheet and Make a copy of a SQL-based View.
Delete tables from ThoughtSpot
Previously, when deleting tables from Connections, ThoughtSpot did not delete the table’s metadata completely. Now, tables deleted through the ThoughtSpot UI disappear completely from your cluster.
Python 3.9 upgrade
Python 3.9 is now the default Python version for all ThoughtSpot Software clusters, regardless of deployment type. ThoughtSpot does not support any other Python release for clusters on ThoughtSpot release 9.0.0.sw and later.
Deploy ThoughtSpot on RHEL, OEL, or Amazon Linux 2 using your LDAP or AD service account
When deploying ThoughtSpot on RHEL, OEL, or Amazon Linux 2, you can use your LDAP or Active Directory service account for installation, instead of using a local user. For more information, see Configure and run the ansible playbook.
Early Access features
Administrators can see the available Early Access features and selectively enable or disable them for all users. To try it out, go to the Admin tab and select Early Access features. For more information, see Enable Early Access features. Early Access features are new in this release. For more information about them, see ThoughtSpot Software release life cycle. Early Access features are disabled by default.
ThoughtSpot Everywhere
Customers licensed to embed ThoughtSpot can use ThoughtSpot Everywhere features and the Visual Embed SDK.
To enable ThoughtSpot Everywhere on your cluster, contact ThoughtSpot Support.
For new features and enhancements introduced in this release for ThoughtSpot Everywhere, see ThoughtSpot Developer Documentation.


